Unlock a world of possibilities! Login now and discover the exclusive benefits awaiting you.
- Qlik Community
- :
- All Forums
- :
- QlikView App Dev
- :
- Re: Getting a variable to capture everything in th...
- Subscribe to RSS Feed
- Mark Topic as New
- Mark Topic as Read
- Float this Topic for Current User
- Bookmark
- Subscribe
- Mute
- Printer Friendly Page
- Mark as New
- Bookmark
- Subscribe
- Mute
- Subscribe to RSS Feed
- Permalink
- Report Inappropriate Content
Getting a variable to capture everything in the selected variable defined
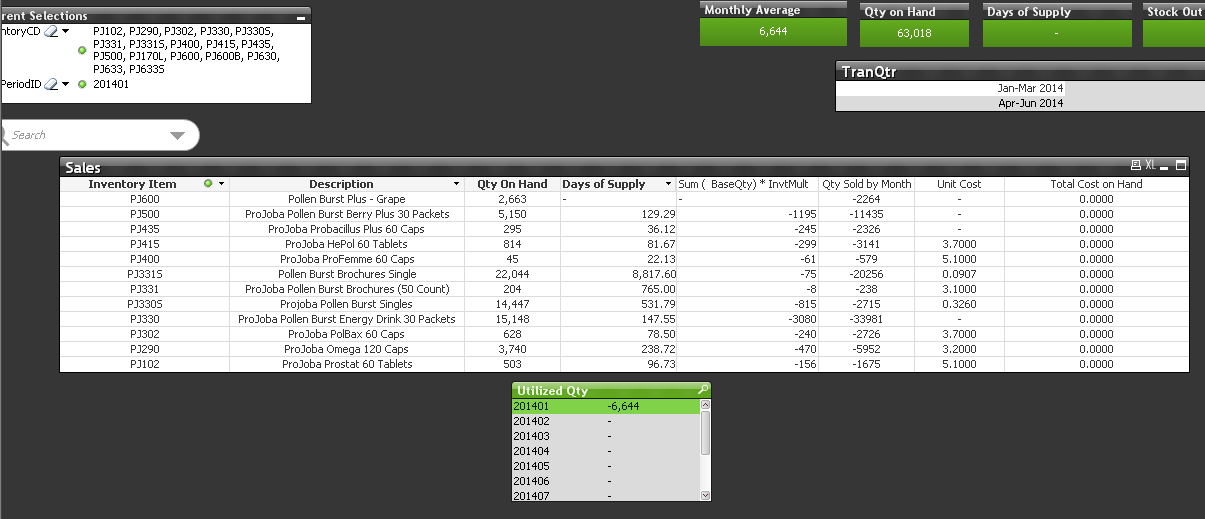
I have a formula: =num(aggr( $(MonthlyAvg),InventoryCD,Descr,QtyOnHand), '###,##0') this equals my monthly average for selected dates.
My problem is that this formula is showing everything greater then 0. I need a way for it to capture all my inventory items even if they didn't get sold in that time frame. Is there a way to get this to happen? The lowest my monthly average will go is 1.
- Mark as New
- Bookmark
- Subscribe
- Mute
- Subscribe to RSS Feed
- Permalink
- Report Inappropriate Content
If you calculate the $(MonthlyAvg) by doing a sum() / count() , then you can apply a SET ANALYSIS statement in the count() denominator to use ALL days regardless of the selection.
can you share your QVW or at least the formula ?
- Mark as New
- Bookmark
- Subscribe
- Mute
- Subscribe to RSS Feed
- Permalink
- Report Inappropriate Content
Attached is the qvw
- Mark as New
- Bookmark
- Subscribe
- Mute
- Subscribe to RSS Feed
- Permalink
- Report Inappropriate Content
I posted the qvw. Let me know if there is something else I can do.
- Mark as New
- Bookmark
- Subscribe
- Mute
- Subscribe to RSS Feed
- Permalink
- Report Inappropriate Content
I'm not too clear on the app , but i noticed that the denominator is counting the number of months the user has selected. If don't select any and there are multiple months the whole expression evaluates to NULL
(Sum (BaseQty) * InvtMult)
/
(GetSelectedCount(TranPeriodID))*-1
so i changed the formula of the variable in the denominator to count the POSSIBLE months (in white) however i'm not even sure that is correct
(Sum (BaseQty) * InvtMult)
/
(GetpossibleCount(TranPeriodID))*-1
You can also dynamically count (could be a different month count for each row) using the following instead as well.
=num(
aggr(
(Sum (BaseQty) * InvtMult)
/
(count( distinct TranPeriodID))*-1
,InventoryCD,Descr,QtyOnHand)
, '###,##0')
... is this the issue you are looking to correct ?
- Mark as New
- Bookmark
- Subscribe
- Mute
- Subscribe to RSS Feed
- Permalink
- Report Inappropriate Content
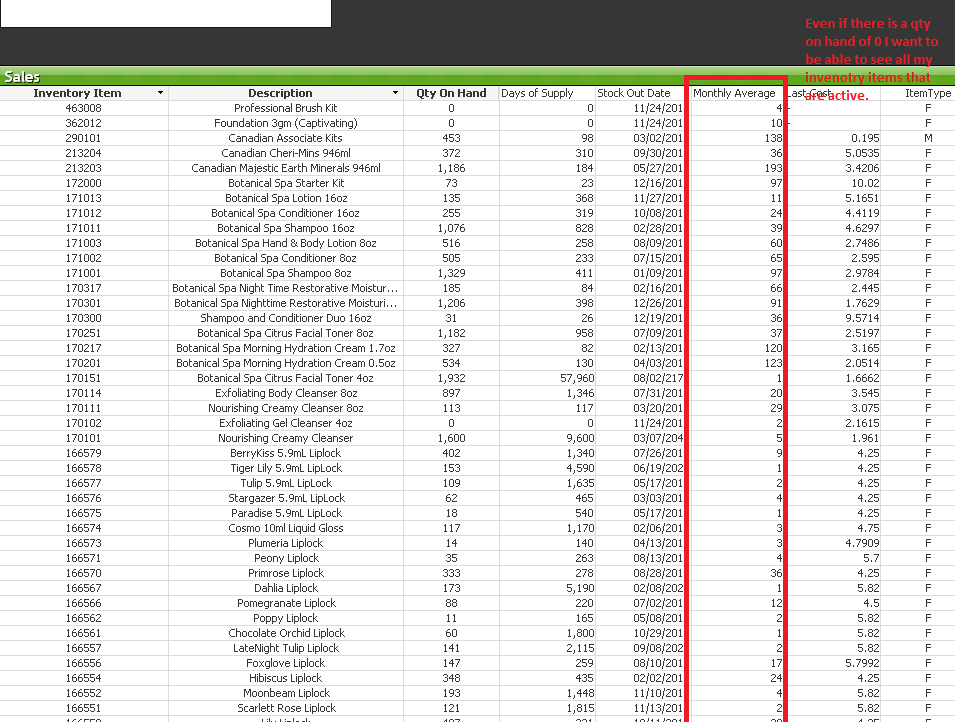
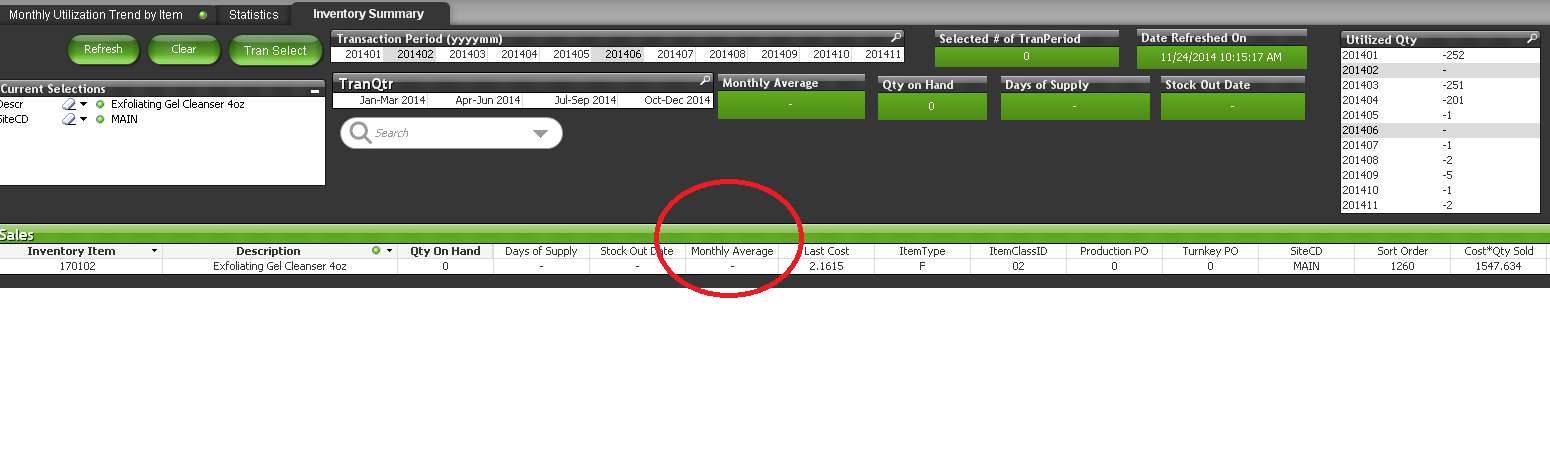
I don't think this is what I'm looking for. What I know is that I have inventory items that have not been sold during the months that I selected and I am wanting them to show up even if there were no sales.
What I am seeing is that it may have something to do with the monthly average?
For example I have item PJ330BX was only bought 201407 and 201411 but if i were to click 201408 the item doesn't show up... Is there a way to even if it wasn't sold in 2014108-201410 to get it to still show all the information on that item based on my data there? I'm not sure if there's something I'm missing in my data to get this to happen.
- Mark as New
- Bookmark
- Subscribe
- Mute
- Subscribe to RSS Feed
- Permalink
- Report Inappropriate Content
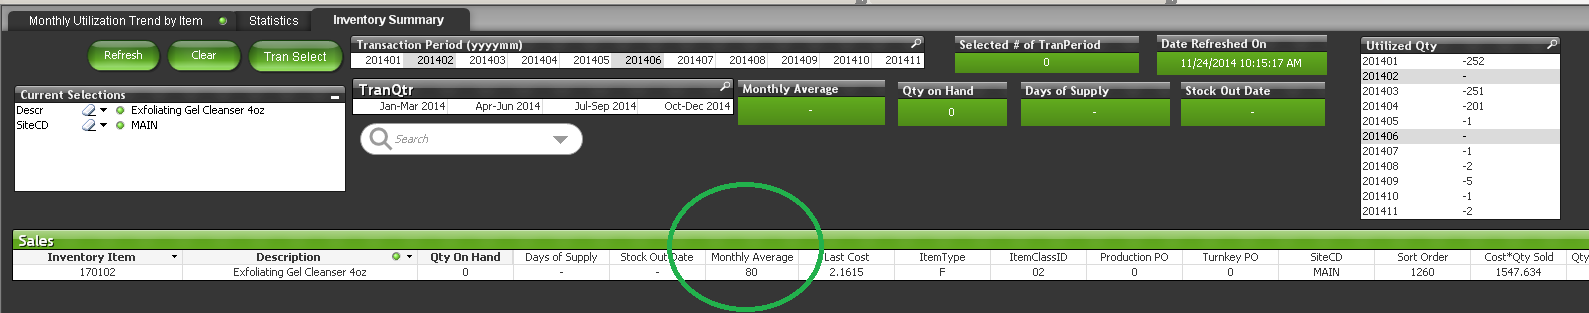
In the Chart i changed 'QTY Sold by Month' from
sum( BaseQty*InvtMult)
To:
sum( {$<TranPeriodID=>} BaseQty*InvtMult)
The SET statement is meant to eliminate any TranPeriodID filter from the equation.
So here i have no TranPeriodID selected with 10 or so selected Items:
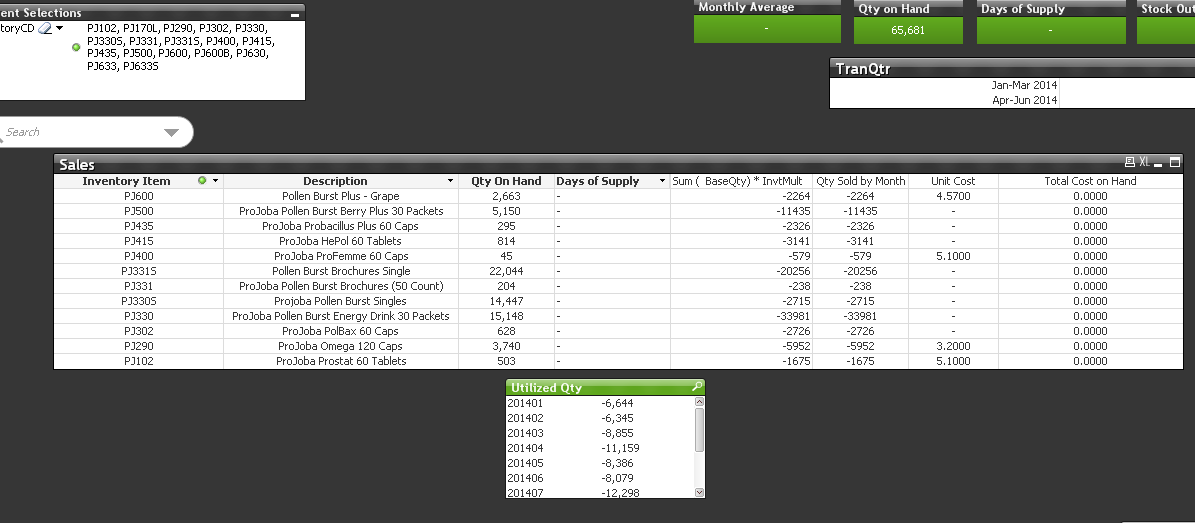
And when i select a month , same items still appear, numbers change but the 'Qty sold by month' does not...