Unlock a world of possibilities! Login now and discover the exclusive benefits awaiting you.
- Qlik Community
- :
- All Forums
- :
- QlikView App Dev
- :
- Google map is not displaying properly.
- Subscribe to RSS Feed
- Mark Topic as New
- Mark Topic as Read
- Float this Topic for Current User
- Bookmark
- Subscribe
- Mute
- Printer Friendly Page
- Mark as New
- Bookmark
- Subscribe
- Mute
- Subscribe to RSS Feed
- Permalink
- Report Inappropriate Content
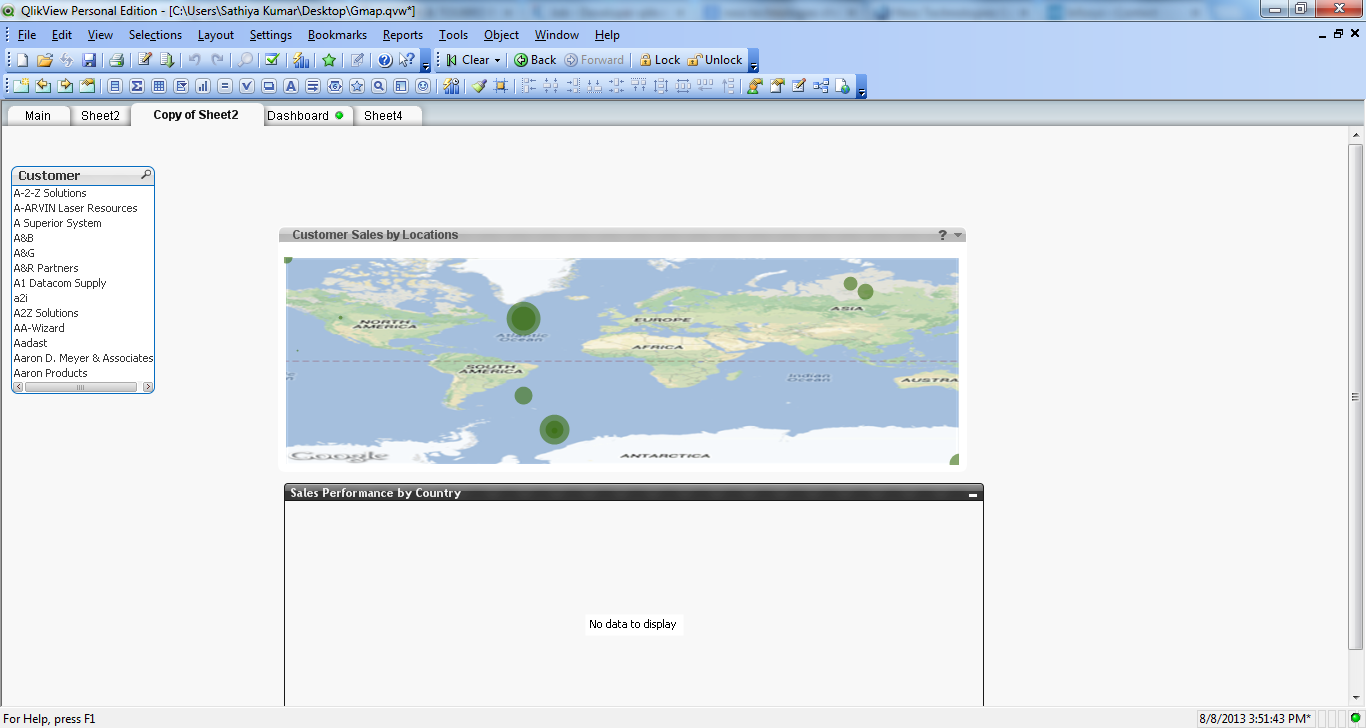
Google map is not displaying properly.
I used the below code in my application to display the map but it was just showing the bubbles only . Not the map, I need to show a demo on how to integrate
the google map with QV 11 to my management with some Sales figure . Somewhere I read API V3 to be used but there is no clarity on how to integrate it .
Please don't share the qvw file as I couldn't open . If you can paste the code here would be helpful.
Can someone pl help.
//===========================================================
// Google Maps in QlikView
// V0.85.2 - October 1st 2008 © Copyright QlikTech International AB 2008 / AES
// Google Maps Key
// get a key here http://code.google.com/apis/maps/signup.html
gmap_key = <I supplied the key here>
max_zoom_level = 17; //maximum value 17
// Variables required for calculating map
// No need to change these
var_pi180= '=pi()/180';
var_lat_offset= '0';
var_long_offset = '0' ;
var_mc2= '=256*pow(2,$(var_zoom))';
var_mc1= '=256*pow(2,($(var_zoom)-1))';
var_mid_lat= '=min(Latitude)+(1+var_lat_offset)*((max(Latitude)-min(Latitude))/2)';
var_mid_long= '=min(Longitude)+(max(Longitude)-min(Longitude))/2';
var_zoom= '=max(aggr(if(max( round(256*pow(2,(_zoom_level -1)))+( Longitude *((256*pow(2,_zoom_level ))/360)) )-min( round(256*pow(2,(_zoom_level -1)))+( Longitude *((256*pow(2,_zoom_level ))/360)) ) <map_size_x AND max((256*pow(2,(_zoom_level-1)))+((0.5*log((1+(sin((Latitude)*pi()/180)))/(1-(sin((Latitude)*pi()/180)))))*((-256*pow(2,_zoom_level))/(2*pi()))))-min((256*pow(2,(_zoom_level-1)))+((0.5*log((1+(sin((Latitude)*pi()/180)))/(1-(sin((Latitude)*pi()/180)))))*((-256*pow(2,_zoom_level))/(2*pi()))))<map_size_y,_zoom_level,1),_zoom_level))';
var_maptype= '=if(isnull(only(maptype)),fieldvalue( '& CHR(39)&'maptype'& CHR(39)&', 1 ),maptype)';
map_size_x= '640';
map_size_y= '400';
SET HidePrefix='_' ;
// Field required for calcualting best zoom level
_zoom_level:
LOAD RecNo() AS _zoom_level AutoGenerate(max_zoom_level);
maptype:
LOAD * INLINE [
maptype
roadmap
mobile
satellite
terrain
hybrid];
LOAD * INLINE [
Customer,longitude,latitude,Sales
A-2-Z Solutions,255.7215289,193.6156805,$343,080
A-ARVIN Laser Resources,149.1185778,193.8956368,$8,570
A Superior System,273.9249778,160.2935876,$206,122
A&B,510.4355556,389.1459995,$233,533
A&G,273.8488889,160.0671736,$29,407
A&R Partners,116.97408,210.5743431,$94,298
A1 Datacom Supply,255.7215289,193.6156805,$719,334
a2i,123.7016178,184.0182003,$1,603
A2Z Solutions,447.0129778,203.584361,$118,897
AA-Wizard,255.8215111,170.2507825,$210,151
Aadast,273.8157511,160.2736679,$559,991
Aaron D. Meyer & Associates,455.5259733,201.4449869,$171,168
Aaron Products,445.9318044,205.3413254,Aaron Products : $7,443
];
- Tags:
- new_to_qlikview
- « Previous Replies
-
- 1
- 2
- Next Replies »
- Mark as New
- Bookmark
- Subscribe
- Mute
- Subscribe to RSS Feed
- Permalink
- Report Inappropriate Content
I incorporated change suggested by you. Unfortunately, it still remains same , its not showing the map ..
- Mark as New
- Bookmark
- Subscribe
- Mute
- Subscribe to RSS Feed
- Permalink
- Report Inappropriate Content
I was wondering if this one is working in your system ??
- Mark as New
- Bookmark
- Subscribe
- Mute
- Subscribe to RSS Feed
- Permalink
- Report Inappropriate Content
yes it is working for me.
- Mark as New
- Bookmark
- Subscribe
- Mute
- Subscribe to RSS Feed
- Permalink
- Report Inappropriate Content
Thanks a ton Siva. Its working fine now..
But few issues were three .... the data points that I plotted were showing up in the ocean...(:-. I guess its due to the wrong latitude & longitude.. and the clarity is also not that good.
If you can suggest on the clarity and the cause for the bubbles showing in the ocean...
Thanks
Sasken
- Mark as New
- Bookmark
- Subscribe
- Mute
- Subscribe to RSS Feed
- Permalink
- Report Inappropriate Content
- Mark as New
- Bookmark
- Subscribe
- Mute
- Subscribe to RSS Feed
- Permalink
- Report Inappropriate Content
I changed the latitude and longitude but still this issue persists...
I guess the blow URL which am using in the dynamic expression image is not in line with the bubbles defined.
='http://maps.googleapis.com/maps/api/staticmap?center=' & num(var_mid_lat, '##############', '.', ',' ) & ',' & num(var_mid_long, '##############', '.', ',' ) & '&zoom='& $(var_zoom) & '&maptype='& (var_maptype) & '&size=400x400' & '&sensor=false'
Can anyone help on this
- Mark as New
- Bookmark
- Subscribe
- Mute
- Subscribe to RSS Feed
- Permalink
- Report Inappropriate Content
Its working perfectly now.... There is a problem with the way that I was plotting the data...Now i fixed it
BTW thanks for your support Siva
- « Previous Replies
-
- 1
- 2
- Next Replies »