Unlock a world of possibilities! Login now and discover the exclusive benefits awaiting you.
- Qlik Community
- :
- All Forums
- :
- QlikView App Dev
- :
- Re: Graph/Trend on each row of Chart Table
Options
- Subscribe to RSS Feed
- Mark Topic as New
- Mark Topic as Read
- Float this Topic for Current User
- Bookmark
- Subscribe
- Mute
- Printer Friendly Page
Turn on suggestions
Auto-suggest helps you quickly narrow down your search results by suggesting possible matches as you type.
Showing results for
Creator III
2016-03-09
11:05 AM
- Mark as New
- Bookmark
- Subscribe
- Mute
- Subscribe to RSS Feed
- Permalink
- Report Inappropriate Content
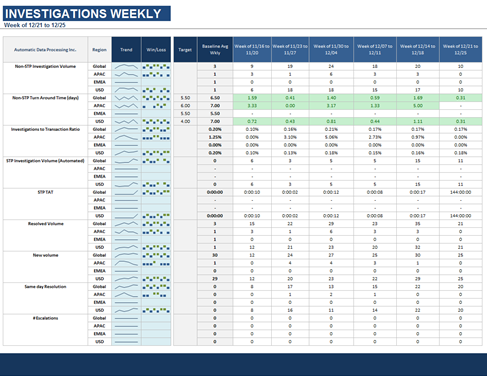
Graph/Trend on each row of Chart Table
Hi Experts
I have requirement like below , want to show trend graph on each row of the chart table.
Any suggestions how we can achieve this?
Thanks in advance.
1,218 Views
4 Replies
Anonymous
Not applicable
2016-03-09
11:14 AM
- Mark as New
- Bookmark
- Subscribe
- Mute
- Subscribe to RSS Feed
- Permalink
- Report Inappropriate Content
Looks like you need a Straight Table with the required Expressions set to have a Display Option Representation of Mini Chart.
One as a Sparkline and the other as Dots.
Creator III
2016-03-09
11:21 AM
Author
- Mark as New
- Bookmark
- Subscribe
- Mute
- Subscribe to RSS Feed
- Permalink
- Report Inappropriate Content
Thanks Bill, this is exactly what i needed.
973 Views
Anonymous
Not applicable
2016-03-09
11:37 AM
- Mark as New
- Bookmark
- Subscribe
- Mute
- Subscribe to RSS Feed
- Permalink
- Report Inappropriate Content
No worries, glad you are on the road.
Those mini charts can be most useful when needed.
973 Views
Creator III
2016-03-09
11:51 AM
Author
- Mark as New
- Bookmark
- Subscribe
- Mute
- Subscribe to RSS Feed
- Permalink
- Report Inappropriate Content
Thanks Bill..
I am stuck with one more issue , can you have a look and provide your suggestions?
973 Views