Unlock a world of possibilities! Login now and discover the exclusive benefits awaiting you.
- Qlik Community
- :
- All Forums
- :
- QlikView App Dev
- :
- Re: Graph axis formating help please?
- Subscribe to RSS Feed
- Mark Topic as New
- Mark Topic as Read
- Float this Topic for Current User
- Bookmark
- Subscribe
- Mute
- Printer Friendly Page
- Mark as New
- Bookmark
- Subscribe
- Mute
- Subscribe to RSS Feed
- Permalink
- Report Inappropriate Content
Graph axis formating help please?
Hi , I have set up a graph to show monthly sales value and formatted the expression the number field to be currency however my graph axis continues to show no £ sign. What am I doing wrong?
thanks,
Janet
- Tags:
- new_to_qlikview
Accepted Solutions
- Mark as New
- Bookmark
- Subscribe
- Mute
- Subscribe to RSS Feed
- Permalink
- Report Inappropriate Content
Hi Janet,
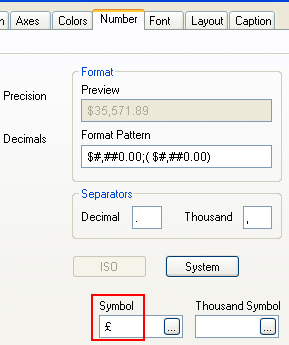
For axis to show £ symbol, you need to make the expression's format as money/currency (Which I think you have already done) and then add £ in Symbol box :
Hope this helps!
Regards,
Shyamal
- Mark as New
- Bookmark
- Subscribe
- Mute
- Subscribe to RSS Feed
- Permalink
- Report Inappropriate Content
On the Number tab of the chart properties, did you add the £ sign to the 'Symbol' box?
- Mark as New
- Bookmark
- Subscribe
- Mute
- Subscribe to RSS Feed
- Permalink
- Report Inappropriate Content
in properties tab "number" add a symbol.
- Mark as New
- Bookmark
- Subscribe
- Mute
- Subscribe to RSS Feed
- Permalink
- Report Inappropriate Content
Hi Janet,
For axis to show £ symbol, you need to make the expression's format as money/currency (Which I think you have already done) and then add £ in Symbol box :
Hope this helps!
Regards,
Shyamal
- Mark as New
- Bookmark
- Subscribe
- Mute
- Subscribe to RSS Feed
- Permalink
- Report Inappropriate Content
Thanks Guys, that worked fine
- Mark as New
- Bookmark
- Subscribe
- Mute
- Subscribe to RSS Feed
- Permalink
- Report Inappropriate Content
Hi Janet, can you please mark the answer correct/helpful if it was useful for you.