Unlock a world of possibilities! Login now and discover the exclusive benefits awaiting you.
- Qlik Community
- :
- All Forums
- :
- QlikView App Dev
- :
- Re: Graph column in Pivot Table
- Subscribe to RSS Feed
- Mark Topic as New
- Mark Topic as Read
- Float this Topic for Current User
- Bookmark
- Subscribe
- Mute
- Printer Friendly Page
- Mark as New
- Bookmark
- Subscribe
- Mute
- Subscribe to RSS Feed
- Permalink
- Report Inappropriate Content
Graph column in Pivot Table
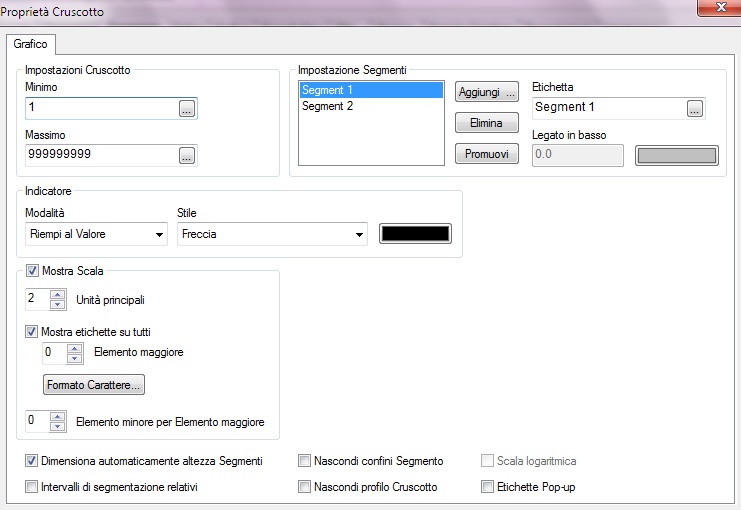
Hello i need to add a graph dimension in a pivot table, can you tell me how to set the minimum and maximum range in the settings?
I set the minimum and maximum like 0, 999999999 but it seems to not show me nothing of significant data.
Thanks
Marco
- « Previous Replies
-
- 1
- 2
- Next Replies »
- Mark as New
- Bookmark
- Subscribe
- Mute
- Subscribe to RSS Feed
- Permalink
- Report Inappropriate Content
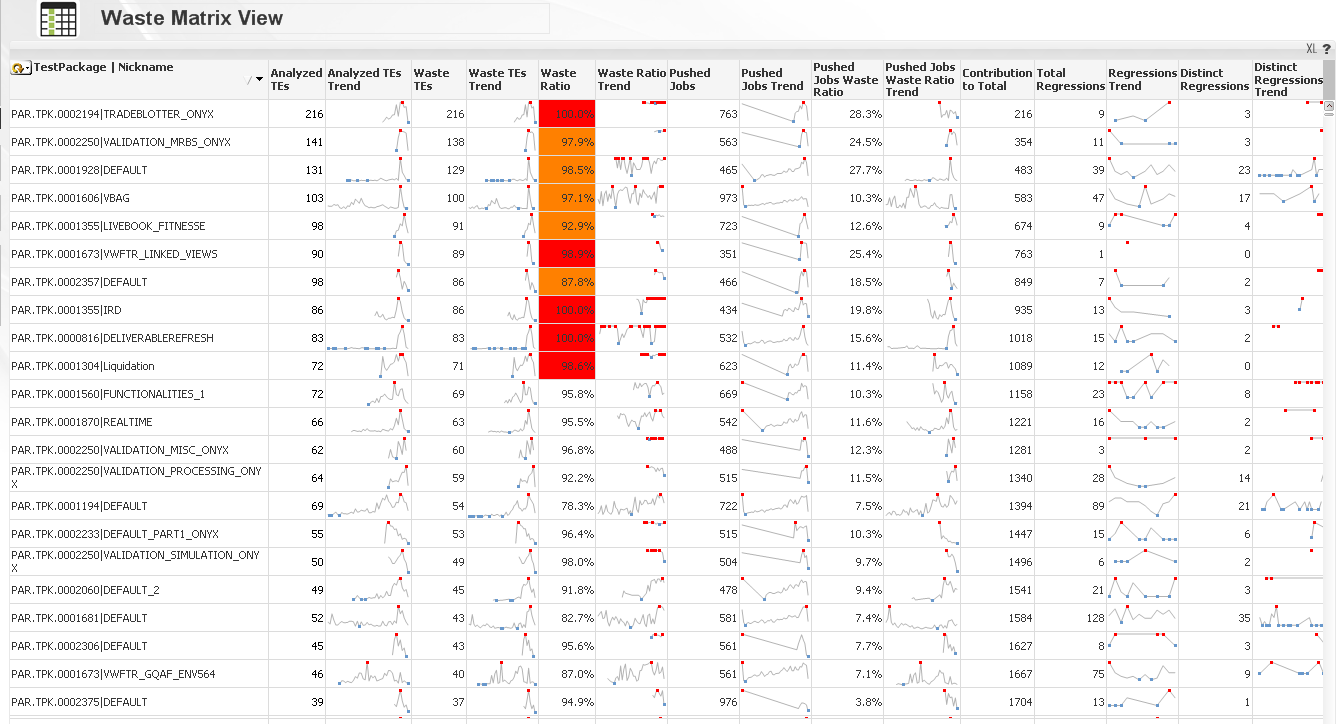
you can specify this in the expression itself
for example I got a pivot table and i have a cell to display count of a metric from a date date1 to a another date date2
the expression is as follows:
count
(
DISTINCT
{
<
Year=
,Month=
,CALENDAR_DATE={">= $(vFromDate) <=$(vToDate)"}
,RECORD_TYPE={'WASTE'}
>
}TEST_ID)
and the result is as follows:
- Mark as New
- Bookmark
- Subscribe
- Mute
- Subscribe to RSS Feed
- Permalink
- Report Inappropriate Content
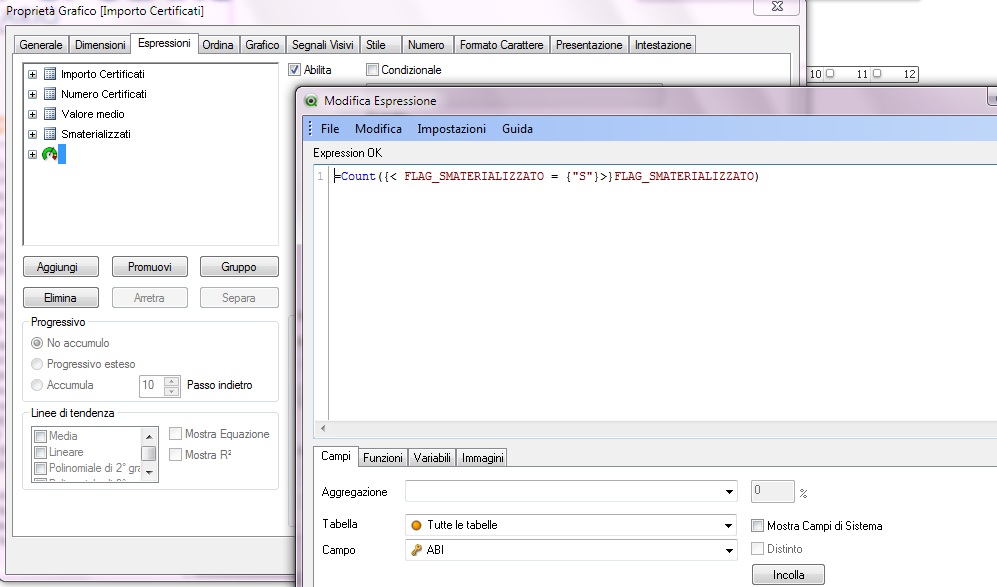
I need a graphic column that represents the previous numeric count of data.
In my example there is a field that contains the count of a field, so i need a graphic expression used to show this in a linear graph mode.
This is the expression:
The settings
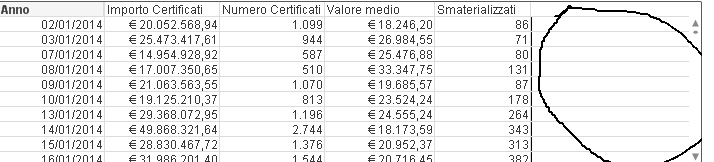
This is the result
- Mark as New
- Bookmark
- Subscribe
- Mute
- Subscribe to RSS Feed
- Permalink
- Report Inappropriate Content
86 compared to 99999999 is too small to be represented
instead of putting 99999999 put an expression like =max(your_field)
- Mark as New
- Bookmark
- Subscribe
- Mute
- Subscribe to RSS Feed
- Permalink
- Report Inappropriate Content
If i use this expression, in the column:
=Max(Count({< FLAG_SMATERIALIZZATO = {"S"}>}FLAG_SMATERIALIZZATO))
is reported this error:
"Minimum and Maximum Value wrong for the graph". (I have translated from itaian version)
Marco
- Mark as New
- Bookmark
- Subscribe
- Mute
- Subscribe to RSS Feed
- Permalink
- Report Inappropriate Content
use max(aggr(sum.....,your_dimension))
- Mark as New
- Bookmark
- Subscribe
- Mute
- Subscribe to RSS Feed
- Permalink
- Report Inappropriate Content
can you send me a sample qvw file?
- Mark as New
- Bookmark
- Subscribe
- Mute
- Subscribe to RSS Feed
- Permalink
- Report Inappropriate Content
What do you intend for dimension in case of use of this formula:
=Max(Count({< FLAG_SMATERIALIZZATO = {"S"}>}FLAG_SMATERIALIZZATO))
Marco
- Mark as New
- Bookmark
- Subscribe
- Mute
- Subscribe to RSS Feed
- Permalink
- Report Inappropriate Content
use
max(aggr(count({< FLAG_SMATERIALIZZATO = {"S"}>}FLAG_SMATERIALIZZATO)),Dimension))
Dimension is the column you added in your dimension list
- Mark as New
- Bookmark
- Subscribe
- Mute
- Subscribe to RSS Feed
- Permalink
- Report Inappropriate Content
I have added this expression:
max(aggr(count({< FLAG_SMATERIALIZZATO = {"S"}>}FLAG_SMATERIALIZZATO)),DATA_PRES)
But it still doesn't work.
Marco
- « Previous Replies
-
- 1
- 2
- Next Replies »