Unlock a world of possibilities! Login now and discover the exclusive benefits awaiting you.
- Qlik Community
- :
- All Forums
- :
- QlikView App Dev
- :
- Re: Grid Chart Background Expression - Editor says...
- Subscribe to RSS Feed
- Mark Topic as New
- Mark Topic as Read
- Float this Topic for Current User
- Bookmark
- Subscribe
- Mute
- Printer Friendly Page
- Mark as New
- Bookmark
- Subscribe
- Mute
- Subscribe to RSS Feed
- Permalink
- Report Inappropriate Content
Grid Chart Background Expression - Editor says OK, but Syntax not recognised
In a grid chart I am trying to highlight a specific bubble with a different colour from the rest using a Background Expression. Dimension 1 is Var1 which is a categorical variable; dimension 2 is "round([Var2],0.01)", i.e a variant of Var2 whereby this is a numerical variable which has been categorised via the round function. 'Highlight 1' is set via an Input Box and is a value taken from the set of values spanned by Var3. I try to identify in the if-condition the bubble into which 'Highlight 1' falls according to the two dimensions and set the colour of that bubble to lightblue, for all others I leave it on lightred.
The expression editor indicates at the top 'Expression OK', but then the 'and' and the second 'Only' are not highlighted in blue, which indicates that the editor does not recognise those as keywords. My suspicion is that there is a syntax problem as none of the bubbles is ever turned blue, but I cannot identify any syntactical mistakes.
if([Var1]=Only({$<[Var3]=("Highlight 1")>} [Var1]) and round([Var2],0.01)
=round(Only({$<[Var3]=("Highlight 1")>} [Var2]),0.01)
,lightblue()
,lightred())
Trying to test it I find that replacing the Only()-expressions with outright values from Var1 and the rounded Var2 the expression works.
Thanks for any help.
Tony
- Tags:
- new_to_qlikview
Accepted Solutions
- Mark as New
- Bookmark
- Subscribe
- Mute
- Subscribe to RSS Feed
- Permalink
- Report Inappropriate Content
Hi,
problem is that in large bubble you have more values. If you use [Var2] in Round([Var2]) you are actually using Only([Var2]). And as you said in the bigger bubbles you have more than one value therefore you get Null returned.
if([Var1]=Only({$<[Var3]={'$(Highlight 1)'}>} [Var1])
and round([Var2],0.01) --> this is Null
=round(Only({$<[Var3]={'$(Highlight 1)'}>} [Var2]),0.01)
,lightblue()
,lightred())
I created a pivot to show it but I don't know how to attach a qvw so I'm showing screenshot instead. The problem is framed in green color.
At the end what seems to work for me is
if([Var1]=Only({$<[Var3]={'$(Highlight 1)'}>} [Var1])
and round(Avg([Var2]),1)
=round(Only({$<[Var3]={'$(Highlight 1)'}>} [Var2]),1)
,lightblue()
,lightred())
The rounding needs to be changed to 1.
This should have the same functionality as your right chart.
Matus
- Mark as New
- Bookmark
- Subscribe
- Mute
- Subscribe to RSS Feed
- Permalink
- Report Inappropriate Content
Hi Tony,
you need to use {} instead of () to define values in set analysis so it should look like
if([Var1]=Only({$<[Var3]={'Highlight 1'}>} [Var1])    and round([Var2],0.01)
  =round(Only({$<[Var3]={'Highlight 1'}>} [Var2]),0.01)
 ,lightblue()
 ,lightred())
This is the first step and if it still does not work there might be also problem with the Only() because it returns value if there is only one possible value and returns null if there are more.
Hope it helps,
Matus
- Mark as New
- Bookmark
- Subscribe
- Mute
- Subscribe to RSS Feed
- Permalink
- Report Inappropriate Content
Matus,
thanks for trying. I think your proposal works, if 'Highlight 1' is a hardcoded string, but my 'Highlight 1' is a Variable that appears under Settings>Variable Overview and the value of this variable is being set by an Input Box.
Also, I know the Other() function returns null, if it evaluates on more than one record, but the expression still does not work when I control the selection to really only have one record that Only() evaluates on.
Any more ideas?
Tony
- Mark as New
- Bookmark
- Subscribe
- Mute
- Subscribe to RSS Feed
- Permalink
- Report Inappropriate Content
Right - I missed the part about Highlight 1 being a variable. In that case you need to use the $-sign expansion to return the value of the variable. The set analysis part should look like
{$<[Var3]={'$(Highlight 1)'}>}
Matus
- Mark as New
- Bookmark
- Subscribe
- Mute
- Subscribe to RSS Feed
- Permalink
- Report Inappropriate Content
Thanks again, Matus. Indeed the problem with the recognition of the variable 'Highlight 1' has now been resolved. However, the chart still does not behave quite the way I wanted.
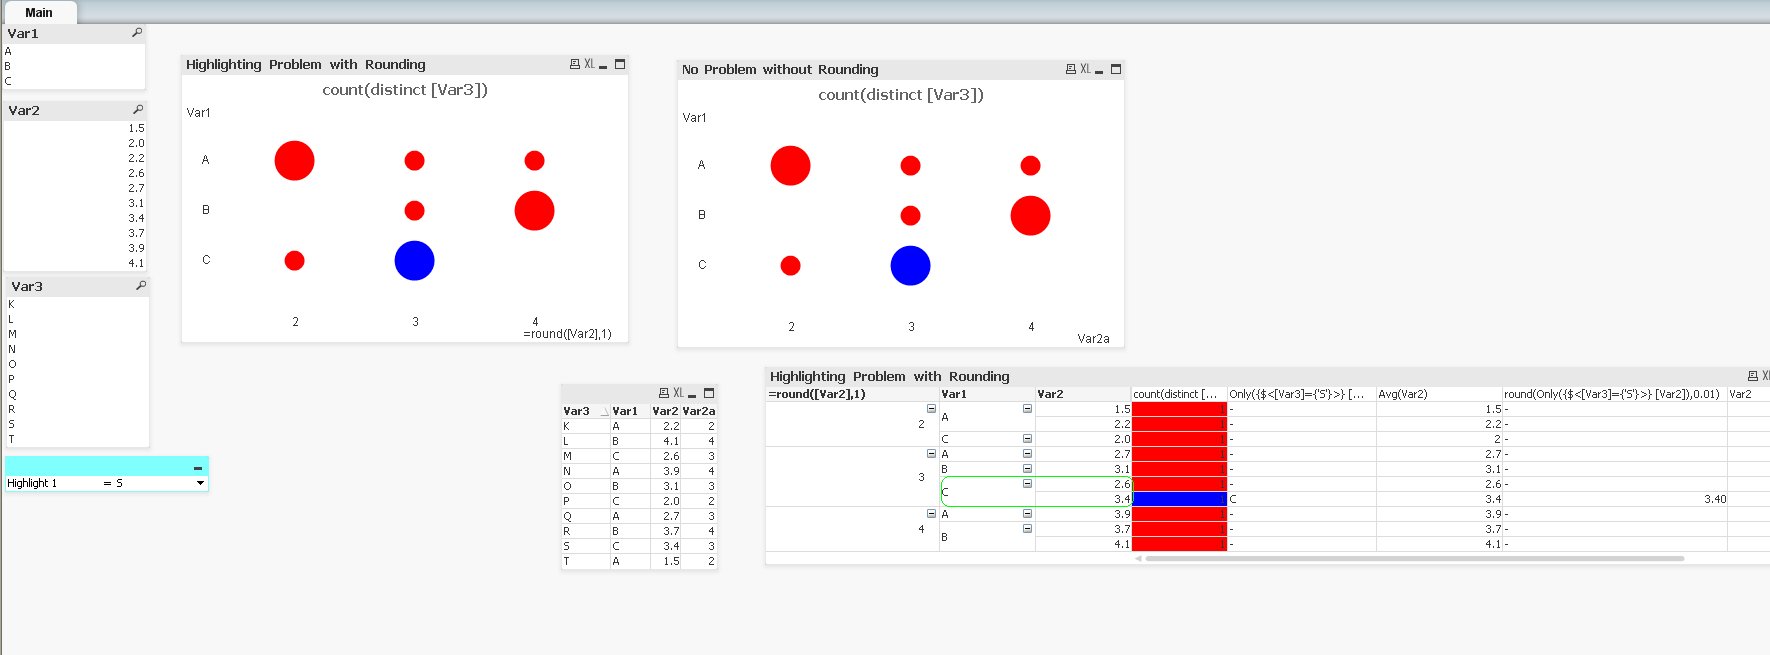
To illustrate the situation I have implemented the situation in a simplified form and attached the file.
To the left you can see the boxes for Var1, Var2 and Var3. At the bottom left you choose 'Highlight 1' via the drop-down menue in the Input Box. At the bottom centre you can see the entire selection dataset.
Now look at the chart to the left. This is the implementation of the grid chart that I described earlier. If you choose various values for 'Highlight 1' then the bubbles turn blue only, if the corresponding bubble is made up only of 1 record, i.e. if it is a small bubble. If, however, you choose a 'Highlight 1' that is contained in a bubble together with other records, i.e. a large bubble, then this bubble remains red, which it should not.
Now look at the chart to the right. This is a copy of the chart to the left, only that, instead of using the round()-function to discretise the values for Var2, I use the already rounded numbers from Var2a and no longer make any use of a round()-function. Here there is always one bubble turning blue, whatever your choice of 'Highlight 1'. This is the way I would like it to have.
So, in theory, I could introduce the rounding of the numbers in the script and then let the chart access the rounded numbers to resolve my problem. But I much prefer to have this resolved within the chart: 1) because my actual data file is much, much larger with hundreds of numeric decimal variables, and 2) for educational reasons, because I do not see why the round()-function should cause any problems here.
Any more suggestions would be much appreciated.
Tony
Message was edited by: amitropoulos - corrected to say 'copy of the chart to the left' instread of 'to the right'
- Mark as New
- Bookmark
- Subscribe
- Mute
- Subscribe to RSS Feed
- Permalink
- Report Inappropriate Content
Hi,
problem is that in large bubble you have more values. If you use [Var2] in Round([Var2]) you are actually using Only([Var2]). And as you said in the bigger bubbles you have more than one value therefore you get Null returned.
if([Var1]=Only({$<[Var3]={'$(Highlight 1)'}>} [Var1])
and round([Var2],0.01) --> this is Null
=round(Only({$<[Var3]={'$(Highlight 1)'}>} [Var2]),0.01)
,lightblue()
,lightred())
I created a pivot to show it but I don't know how to attach a qvw so I'm showing screenshot instead. The problem is framed in green color.
At the end what seems to work for me is
if([Var1]=Only({$<[Var3]={'$(Highlight 1)'}>} [Var1])
and round(Avg([Var2]),1)
=round(Only({$<[Var3]={'$(Highlight 1)'}>} [Var2]),1)
,lightblue()
,lightred())
The rounding needs to be changed to 1.
This should have the same functionality as your right chart.
Matus
- Mark as New
- Bookmark
- Subscribe
- Mute
- Subscribe to RSS Feed
- Permalink
- Report Inappropriate Content
Matus,
this solves the issue! Many great thanks. Indeed, I did not notice that the round()-function is defined only on scalars (the Help page on General Numeric Functions says 'In the functions below, the parameters are expressions where x should be interpreted as a real valued number.') The function Avg() does then the trick to aggregate across a vector to supply the round()-function with a meaningful single number.
Cheers.
BTW. You can attach files by clicking on the link 'Use advanced editor' to the top right hand of the editing field. The advanced editor has a button at the bottom of the editing field that allows to attach files.
Tony
- Mark as New
- Bookmark
- Subscribe
- Mute
- Subscribe to RSS Feed
- Permalink
- Report Inappropriate Content
I'm glad it helped you.
And thanks. I never noticed the advanced editor.
Matus