Unlock a world of possibilities! Login now and discover the exclusive benefits awaiting you.
- Qlik Community
- :
- All Forums
- :
- QlikView App Dev
- :
- Re: Group Column Headers in pivot table
- Subscribe to RSS Feed
- Mark Topic as New
- Mark Topic as Read
- Float this Topic for Current User
- Bookmark
- Subscribe
- Mute
- Printer Friendly Page
- Mark as New
- Bookmark
- Subscribe
- Mute
- Subscribe to RSS Feed
- Permalink
- Report Inappropriate Content
Group Column Headers in pivot table
Hi.
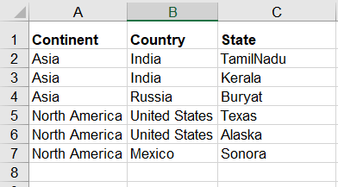
My requirement is, I want to display the below table into the output shown below:
Data:
Output:
I have searched quite a bit but the problem in my case is, there is no expression like sum/only/maxstring etc that I could use here in pivot table. Everything has to be displayed but in a different format.
Can someone please suggest any option available in qlik?
Note: I dont want to use textboxes because my data will change based on filters. So, would be better if it could be solved using pivot or straight tables or any other way that is possible
- Mark as New
- Bookmark
- Subscribe
- Mute
- Subscribe to RSS Feed
- Permalink
- Report Inappropriate Content
we cant do exact same
I tried more closer to your required output
- Mark as New
- Bookmark
- Subscribe
- Mute
- Subscribe to RSS Feed
- Permalink
- Report Inappropriate Content
@Gayathri18 one close solution would be create pivot table with below dimension and measure
Dimension:
Continent
Country
Measure:
=Concat( DISTINCT State,',')
- Mark as New
- Bookmark
- Subscribe
- Mute
- Subscribe to RSS Feed
- Permalink
- Report Inappropriate Content
Sorry for the late response. Your solution is very close to mine although not exact. Thanks for the qvw. But now, I have got a design change to add in an expression column, so working with that.
- Mark as New
- Bookmark
- Subscribe
- Mute
- Subscribe to RSS Feed
- Permalink
- Report Inappropriate Content
Sorry for the late response. Your solution is also close to mine although not exact. But now, I have got a design change to add in an expression column, so working with that.


