Unlock a world of possibilities! Login now and discover the exclusive benefits awaiting you.
- Qlik Community
- :
- All Forums
- :
- QlikView App Dev
- :
- Group by Function
- Subscribe to RSS Feed
- Mark Topic as New
- Mark Topic as Read
- Float this Topic for Current User
- Bookmark
- Subscribe
- Mute
- Printer Friendly Page
- Mark as New
- Bookmark
- Subscribe
- Mute
- Subscribe to RSS Feed
- Permalink
- Report Inappropriate Content
Group by Function
Friends,
As per my requirement, I have two formats for each fields (Source and destination format) for a customer in a table. But I want to display the no. of fields by source and destination as shown in the below grouped bar chart,
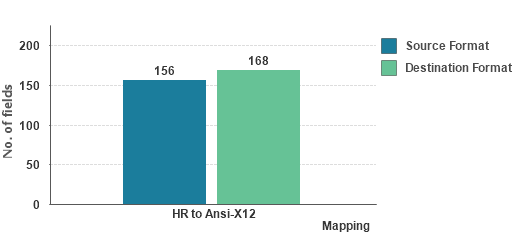
I'm confused how to group the fields by source and destination and also attached sample data. Plz help me to do this.
- Mark as New
- Bookmark
- Subscribe
- Mute
- Subscribe to RSS Feed
- Permalink
- Report Inappropriate Content
i don't understand what this chart is supposed to show!
You had 156 fields in source system in HR format and after conversion you had 168 in Ansi-X12 format?
What should the chart be like per your data sample?
If a post helps to resolve your issue, please accept it as a Solution.
- Mark as New
- Bookmark
- Subscribe
- Mute
- Subscribe to RSS Feed
- Permalink
- Report Inappropriate Content
Check out reply here
- Mark as New
- Bookmark
- Subscribe
- Mute
- Subscribe to RSS Feed
- Permalink
- Report Inappropriate Content
Can you share the output expected from your sample data. Looks like you have attached wrong data sample. Please verify and explain how nos would be different for both formats since each row reflects data related to both the formats.