Unlock a world of possibilities! Login now and discover the exclusive benefits awaiting you.
- Qlik Community
- :
- All Forums
- :
- QlikView App Dev
- :
- Group by on key value, but show the corresponding ...
- Subscribe to RSS Feed
- Mark Topic as New
- Mark Topic as Read
- Float this Topic for Current User
- Bookmark
- Subscribe
- Mute
- Printer Friendly Page
- Mark as New
- Bookmark
- Subscribe
- Mute
- Subscribe to RSS Feed
- Permalink
- Report Inappropriate Content
Group by on key value, but show the corresponding description field in bar chart
Hi,
I am pretty new to Qlikview development and stuck while making a bar chart. Here's the scenario:
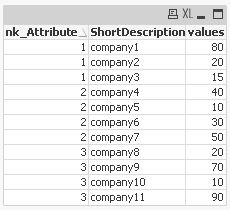
We're displaying a company data and bench-marking their data against all other companies in a bar chart. On the X-axis, we want to display the "ShortDescription" field and on Y-axis their corresponding values. The catch is, the field "ShortDescription" varies for different companies, so we can't group on that. However, they can be grouped by a key value, "nk_Attribute", but in that case values getting displayed on the X-axis is "nk_Attribute".
So my question is, how do I group the data on "nk_Attribute", but display the field "ShortDescription" in the bar chart.
Thanks!
- Mark as New
- Bookmark
- Subscribe
- Mute
- Subscribe to RSS Feed
- Permalink
- Report Inappropriate Content
Could you post a sample?
- Mark as New
- Bookmark
- Subscribe
- Mute
- Subscribe to RSS Feed
- Permalink
- Report Inappropriate Content
Dear ,
can you attach the file.
Thanks,
Mukram
- Mark as New
- Bookmark
- Subscribe
- Mute
- Subscribe to RSS Feed
- Permalink
- Report Inappropriate Content
Hi,
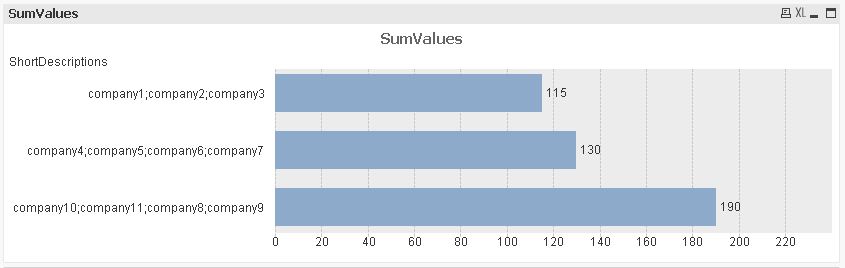
supposed I understood your requirements correctly, you want to group by the nk_Attribute field, meaning this would be your dimension. But instead of showing the nk_Attributes on the dimension axis, you want to show THE ShortDescription value. As you suggest the ShortDescription would vary between different companies, there can't be a single ShortDescription value per nk_Attribute value. Therefore I tried to create a calculated dimension that aggregates (concatenates) the ShortDescriptions over the nk_Attribute field. I used the dual() function to create numerical (nk_Attribute) dimension values to be able to sort the dimension numerically:
=Aggr(Dual(Concat(ShortDescription, ';'),nk_Attribute),nk_Attribute)
hope this helps
regards
Marco
- Mark as New
- Bookmark
- Subscribe
- Mute
- Subscribe to RSS Feed
- Permalink
- Report Inappropriate Content
Hi,
please close this thread if there are no further questions.
Thanks
Regards
Marco