Unlock a world of possibilities! Login now and discover the exclusive benefits awaiting you.
- Qlik Community
- :
- All Forums
- :
- QlikView App Dev
- :
- Re: Group chart style not working
- Subscribe to RSS Feed
- Mark Topic as New
- Mark Topic as Read
- Float this Topic for Current User
- Bookmark
- Subscribe
- Mute
- Printer Friendly Page
- Mark as New
- Bookmark
- Subscribe
- Mute
- Subscribe to RSS Feed
- Permalink
- Report Inappropriate Content
Group chart style not working
Hi Experts,
I am developing a standard report for my users.
Based on my scenario I have created a sample QVW as attached.
My actual data table is :
| Activity | Priority | LastYCount | ThisYCount |
| Incidents | P1 | 654 | 147 |
| Incidents | P2 | 842 | 258 |
| Incidents | P3 | 248 | 369 |
| Responses | P1 | 358 | 963 |
| Responses | P2 | 359 | 852 |
| Responses | P3 | 652 | 741 |
The display as requested by user is:
| Activity | Prirty | ThisY | LastY |
| Incidents | P1 | 147 | 654 |
| Incidents | P1-P2 | 405 | 1496 |
| Incidents | P1-P3 | 516 | 902 |
| Incidents | P2 | 258 | 842 |
| Incidents | Total | 774 | 1744 |
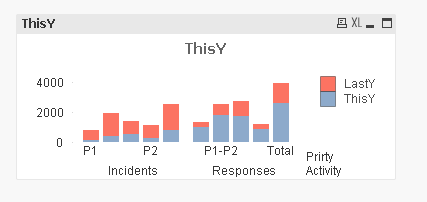
This display has subtotals for P1-P2 and P1-P3. To achieve this I have created a custom field and used the formulas as shown in the application.
However, I am unable to get the Grouped style chart working anymore. May be because of the formulas/functions I used.
Could you please suggest whats going wrong? I need a grouped bars in the chart diagram.
Thanks in advance.
Regards,
Shyam.
- Mark as New
- Bookmark
- Subscribe
- Mute
- Subscribe to RSS Feed
- Permalink
- Report Inappropriate Content
is like this?
- Mark as New
- Bookmark
- Subscribe
- Mute
- Subscribe to RSS Feed
- Permalink
- Report Inappropriate Content
Thanks for the response x mg.
I want a grouped bars in the chart.
Thanks in advance.
- Mark as New
- Bookmark
- Subscribe
- Mute
- Subscribe to RSS Feed
- Permalink
- Report Inappropriate Content
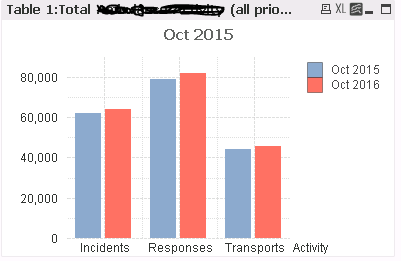
What does a grouped bars mean? Could you give me some graph to explain it?
- Mark as New
- Bookmark
- Subscribe
- Mute
- Subscribe to RSS Feed
- Permalink
- Report Inappropriate Content
like this?
- Mark as New
- Bookmark
- Subscribe
- Mute
- Subscribe to RSS Feed
- Permalink
- Report Inappropriate Content
- Mark as New
- Bookmark
- Subscribe
- Mute
- Subscribe to RSS Feed
- Permalink
- Report Inappropriate Content
Hi x mg,
Please see the image i attached in my earlier post.