Unlock a world of possibilities! Login now and discover the exclusive benefits awaiting you.
- Qlik Community
- :
- All Forums
- :
- QlikView App Dev
- :
- Group relative full accumulation into groups of 80...
- Subscribe to RSS Feed
- Mark Topic as New
- Mark Topic as Read
- Float this Topic for Current User
- Bookmark
- Subscribe
- Mute
- Printer Friendly Page
- Mark as New
- Bookmark
- Subscribe
- Mute
- Subscribe to RSS Feed
- Permalink
- Report Inappropriate Content
Group relative full accumulation into groups of 80%, 15% and 5% rules
Hi,
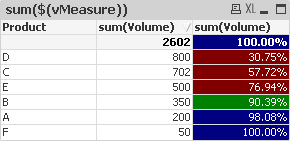
I need help here on how to dynamically group the relative full accumulation percentage into 80-15-5 rules and present the grouping in a stacked bar chart.
Attached is the qvw that I have done it using scripting but I am not able to recalculate the percentage based on other association/filters eg. product group. If filter the product by product group the 80-15-5 percentage should be recalculate and change. Now I am not able to achieve that because the calculation rules has been coded in the script.
Does anyone have idea on how to turn the below table chart into a stacked bar chart from front end instead of back-end scripting?

Accepted Solutions
- Mark as New
- Bookmark
- Subscribe
- Mute
- Subscribe to RSS Feed
- Permalink
- Report Inappropriate Content
- Mark as New
- Bookmark
- Subscribe
- Mute
- Subscribe to RSS Feed
- Permalink
- Report Inappropriate Content
Hi Joane,
I think you can find the answer in my recent blog article:
http://www.naturalsynergies.com/q-tip-11-so-how-many-customers-make-up-most-of-your-sales/
cheers,
Oleg Troyansky
QlikView Your Business: An expert guide to Business Discovery with QlikView and Qlik Sense
- Mark as New
- Bookmark
- Subscribe
- Mute
- Subscribe to RSS Feed
- Permalink
- Report Inappropriate Content
See Recipe for a Pareto Analysis
HIC
- Mark as New
- Bookmark
- Subscribe
- Mute
- Subscribe to RSS Feed
- Permalink
- Report Inappropriate Content
Thanks Henric.
Very good article.