Unlock a world of possibilities! Login now and discover the exclusive benefits awaiting you.
- Qlik Community
- :
- All Forums
- :
- QlikView App Dev
- :
- Re: Grouping Dimensions in a Scatter Chart
- Subscribe to RSS Feed
- Mark Topic as New
- Mark Topic as Read
- Float this Topic for Current User
- Bookmark
- Subscribe
- Mute
- Printer Friendly Page
- Mark as New
- Bookmark
- Subscribe
- Mute
- Subscribe to RSS Feed
- Permalink
- Report Inappropriate Content
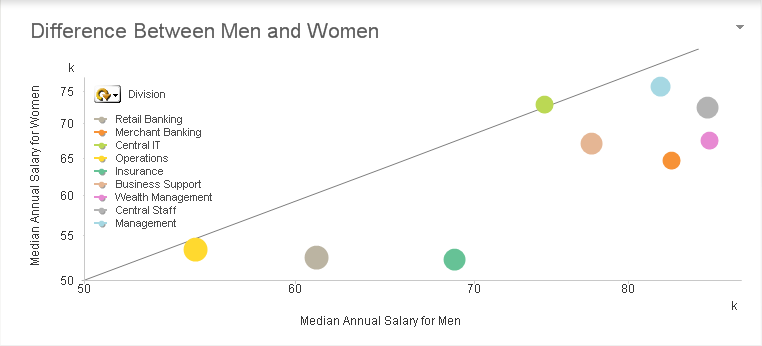
Grouping Dimensions in a Scatter Chart
Hey QlikCommunity!
I group dimensions a lot with the charts that I build. When I put a grouped dimension in a scatter chart, however, the ability to cycle between dimensions disappears. Is there any way to build this functionality on the chart without putting a list box on the side?
-Nick
- Tags:
- new_to_qlikview
- Mark as New
- Bookmark
- Subscribe
- Mute
- Subscribe to RSS Feed
- Permalink
- Report Inappropriate Content
Hmm that seems strange, you should be able to cycle your dimensions in a scatter chart.
Make sure your label and legend are active - if you played around with the sizing of the chart you could also reset the user sizing and docking under the general tab to get back to square one.
Just tried it on QV11.2 SR2 and works on my box.
- Mark as New
- Bookmark
- Subscribe
- Mute
- Subscribe to RSS Feed
- Permalink
- Report Inappropriate Content
This is happening to me now as well. The cycle dimension is in the 3rd Dimension and works fine with nothing selected. However, as soon as I select and get to a point where the current cycle dimension = 1 value, the legend disappears along with the cycle option and the chart re-sizes to the complete width of the container. Is there a way to 'lock' the legend?