Unlock a world of possibilities! Login now and discover the exclusive benefits awaiting you.
- Qlik Community
- :
- All Forums
- :
- QlikView App Dev
- :
- Grouping data by month and person
- Subscribe to RSS Feed
- Mark Topic as New
- Mark Topic as Read
- Float this Topic for Current User
- Bookmark
- Subscribe
- Mute
- Printer Friendly Page
- Mark as New
- Bookmark
- Subscribe
- Mute
- Subscribe to RSS Feed
- Permalink
- Report Inappropriate Content
Grouping data by month and person
Looking for some help here ![]()
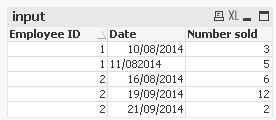
I have a table of sales data per day by employee like so:
| Employee ID | Date | Number sold |
|---|---|---|
| 1 | 10/08/2014 | 3 |
| 1 | 11/082014 | 5 |
| 2 | 16/08/2014 | 6 |
| 2 | 19/09/2014 | 12 |
| 2 | 21/09/2014 | 2 |
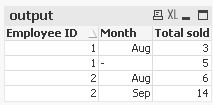
Which I want to convert to a table in the following form:
| Employee ID | Month | Total sold |
|---|---|---|
| 1 | August | 8 |
| 2 | August | 6 |
| 2 | September | 14 |
Basically, total sold by employee for each month. This is probably really easy and I am too tired to work it out, but any help would be much appreciated ![]()
- Mark as New
- Bookmark
- Subscribe
- Mute
- Subscribe to RSS Feed
- Permalink
- Report Inappropriate Content
make a chart (straight table)
with 2 dimensions
Employee ID
=year(Date) & '-' & Month(Date)
and the expression
sum(Sales)
- Mark as New
- Bookmark
- Subscribe
- Mute
- Subscribe to RSS Feed
- Permalink
- Report Inappropriate Content
Sorry if this is obvious, but how would I do this in the loadscript?
- Mark as New
- Bookmark
- Subscribe
- Mute
- Subscribe to RSS Feed
- Permalink
- Report Inappropriate Content
table1:
LOAD [Employee ID],
    Date,
    [Number sold]
FROM
[http://community.qlik.com/thread/129712]
(html, codepage is 1252, embedded labels, table is @1);

table2:
LOAD [Employee ID],
    Month(Date) as Month,
    Sum([Number sold]) as [Total sold]
Resident table1
Group By [Employee ID],Month(Date);
hope this helps
regards
Marco
- Mark as New
- Bookmark
- Subscribe
- Mute
- Subscribe to RSS Feed
- Permalink
- Report Inappropriate Content
Hi,
I have created a resident table based on your example. I performed aggregation on that table..
tempTable: //this table is to emulate the same data set
load * inline [
Employee_ID, Date_Sold, Number_Sold
1, 10/08/2014, 3
1, 11/08/2014, 5
2, 16/08/2014, 6
2, 19/09/2014, 12
2, 21/09/2014, 2
];
finalTable: //perfoming aggregation
load
Employee_ID as Emp_ID,
month(date#(Date_Sold,'DD/MM/YYYY')) as On_Date_Sold,
sum(Number_Sold) as Total_Sale
Resident tempTable
group by
Employee_ID, month(date#(Date_Sold,'DD/MM/YYYY'))
order by 1, 2;
I finally put the columns of the above finalTable in QV's Table Box object.
- Mark as New
- Bookmark
- Subscribe
- Mute
- Subscribe to RSS Feed
- Permalink
- Report Inappropriate Content

if you add the missing slash in your sample table for 11/08/2014, this script should deliver the specified output


hope this helps
regards
Marco