Unlock a world of possibilities! Login now and discover the exclusive benefits awaiting you.
- Qlik Community
- :
- All Forums
- :
- QlikView App Dev
- :
- Grouping data in a table to have one line displaye...
- Subscribe to RSS Feed
- Mark Topic as New
- Mark Topic as Read
- Float this Topic for Current User
- Bookmark
- Subscribe
- Mute
- Printer Friendly Page
- Mark as New
- Bookmark
- Subscribe
- Mute
- Subscribe to RSS Feed
- Permalink
- Report Inappropriate Content
Grouping data in a table to have one line displayed
Hello to all of you
I have an issue with a cross table with data history and I hope someone here can help me. I'll try my best to explain because it's a bit tricky.
I have an Incident table stored in a database (and no way to change the way it's stored, I have to adapt Qlikview model to the DB) this way:
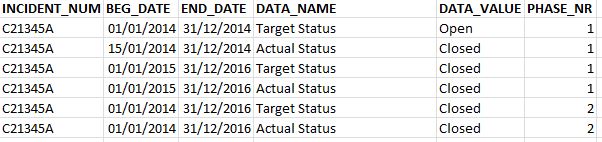
Data are:
Incident_Num => The incident Number
DATA_NAME => Contains my dimensions
DATA_VALUE => Contains the value associated to the dimension
PHASE_NR => It's a project phase code
Each time a "DATA_VALUE" is modified in the source database they create a new line to keep history. For example here:
On 01/01/2014, we specified that the "Actual Status" and "Target Status" for Phase 2 should be "Closed". So the BEG_DATE is "01/01/2014" and the END_DATE is set to "31/12/2016" (by default, when no end, the value is this one).
For Phase 1, on "01/01/2014" we set the Target Status to "Open". Then, on "01/01/2015" the Target Status has been modified to be "Closed". So the END_DATE has been updated for the "Open" value to become "31/12/2014" (previous day). And a new line is written to say that starting on "01/01/2015" the Target Status for Phase 2 is "Closed".
I hope it's clear until now.
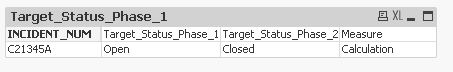
Our final goal is to have a table like this one but with "Target_Status_Phase_1" and "Target_Status_Phase_2" as dimensions and not expressions. And also, we need to be able to select a date in a calendar and see the "Target Status" value for the selected date (to see history).
I have already handled the history part. But I have issue with the display of target status for each phases.
What I have done is:
- Creating a dynamic load that transforms each distinct value of "DATA_NAME" into a dimension ("DATA_VALUE" as value of that dimension). See the "Functions" tab in the attached QVW.
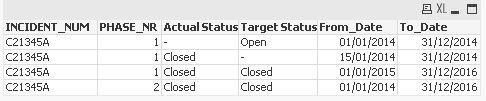
The result is this table. We now have "Actual Status" and "Target Status" as dimension. But still not "Actual Status Phase 1" as dimension.
So then, I have the same kind of thing to transform each "Actual Status / Phase" couple into a dimension (See "Uncross_Next" tab).
I loop on each phase and create the dimension.
Now, I can use each Actual and Target status for each phase as a dimension. But when I create my table I have this:
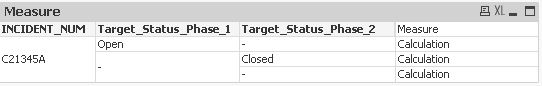
I have selected a "Reference Date" so I can see the values at one specific day. So Target Status for Phase 1 is a unique value, and so is Target Status for Phase 2. But I have several lines. Of course because of the "From / To" range that is not the same.
But I need to have one line for "C21345A" with "Open" as Phase 1 status and "Closed" as Phase 2 status.
Any idea how I could manage to have this please ?
I tried to group by "Incident number" but if I do so, I loose the history function.
Thanks a lot for your help
- Tags:
- qlikview_scripting