Unlock a world of possibilities! Login now and discover the exclusive benefits awaiting you.
- Qlik Community
- :
- All Forums
- :
- QlikView App Dev
- :
- Guage chart help
- Subscribe to RSS Feed
- Mark Topic as New
- Mark Topic as Read
- Float this Topic for Current User
- Bookmark
- Subscribe
- Mute
- Printer Friendly Page
- Mark as New
- Bookmark
- Subscribe
- Mute
- Subscribe to RSS Feed
- Permalink
- Report Inappropriate Content
Guage chart help
Hi,
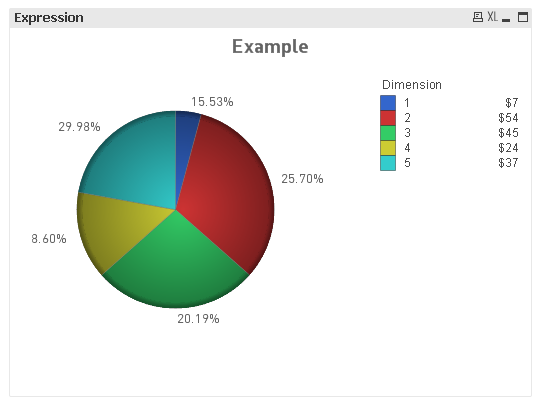
I need percentage and numbers to be shown in gauge chart as per the attached file.
Please help.
Regards,
Suryakant
- « Previous Replies
-
- 1
- 2
- Next Replies »
- Mark as New
- Bookmark
- Subscribe
- Mute
- Subscribe to RSS Feed
- Permalink
- Report Inappropriate Content
Thanks..Well done !!
- Mark as New
- Bookmark
- Subscribe
- Mute
- Subscribe to RSS Feed
- Permalink
- Report Inappropriate Content
Thanks a ton...!!! very helpful solution.
- Mark as New
- Bookmark
- Subscribe
- Mute
- Subscribe to RSS Feed
- Permalink
- Report Inappropriate Content
Hi Ramezani..
This is the exact answer which i was expected. just one query, I have applied same logic and created two piecharts. but when i reopening the file, the percentage piechart is hiding and the blank piechart is coming up at front side. which property i need to made changes for making percenatage pie chart at front side.
Regards,
Suryakant
- Mark as New
- Bookmark
- Subscribe
- Mute
- Subscribe to RSS Feed
- Permalink
- Report Inappropriate Content
Hi Sarvesh, You do not have to create 2 pie charts. The steps above are in a single pie chart. Sorry I did not specify before.
Thanks,
Carlos
- Mark as New
- Bookmark
- Subscribe
- Mute
- Subscribe to RSS Feed
- Permalink
- Report Inappropriate Content
Hi Suryakant,
Once you are done with creating 2 pie charts, you need to set their properties as shown in screenshot. Below is the procedure for the same.
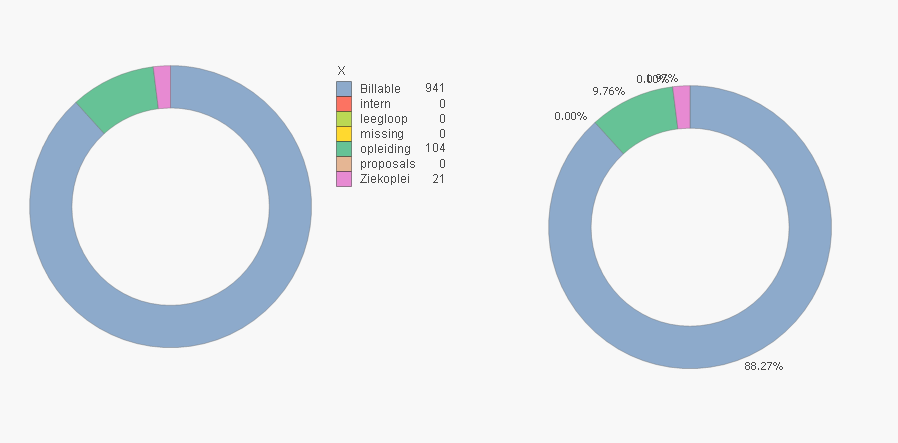
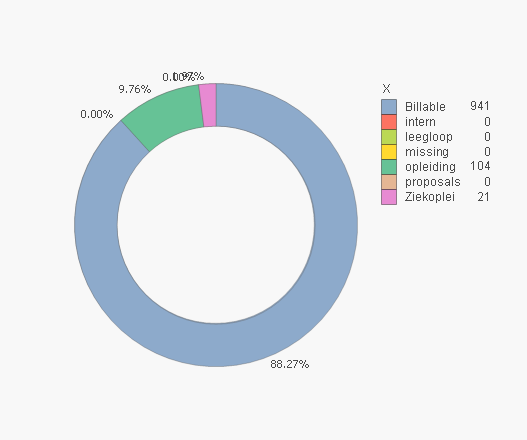
1. Disable show legend property of pie chart in which you are displaying percentage by going to Dimension tab and enable Relative property in Expressions tab , also enable Values on data point property. Now go to Colors tab and set Transparency to 100%
2. For displaying numbers, enable Show legend property of another pie chart and set transparency to 100% in color tab for this pie chart also.
3.Now finally put one of the pie chart on another and set border width to 0 in layout tab of both the charts.
Regards,
Anurag
- Mark as New
- Bookmark
- Subscribe
- Mute
- Subscribe to RSS Feed
- Permalink
- Report Inappropriate Content
Hi Surya,
I think the below expression helps you,
=Round( Your expression *100)&'%'
- Mark as New
- Bookmark
- Subscribe
- Mute
- Subscribe to RSS Feed
- Permalink
- Report Inappropriate Content
Hi..
If your problem has been solved then mark this "Correct and Helpful" to close this thread.
- « Previous Replies
-
- 1
- 2
- Next Replies »