Unlock a world of possibilities! Login now and discover the exclusive benefits awaiting you.
- Qlik Community
- :
- All Forums
- :
- QlikView App Dev
- :
- Re: Handling multiple dates in X axis Time dimensi...
- Subscribe to RSS Feed
- Mark Topic as New
- Mark Topic as Read
- Float this Topic for Current User
- Bookmark
- Subscribe
- Mute
- Printer Friendly Page
- Mark as New
- Bookmark
- Subscribe
- Mute
- Subscribe to RSS Feed
- Permalink
- Report Inappropriate Content
Handling multiple dates in X axis Time dimension
Hello all,
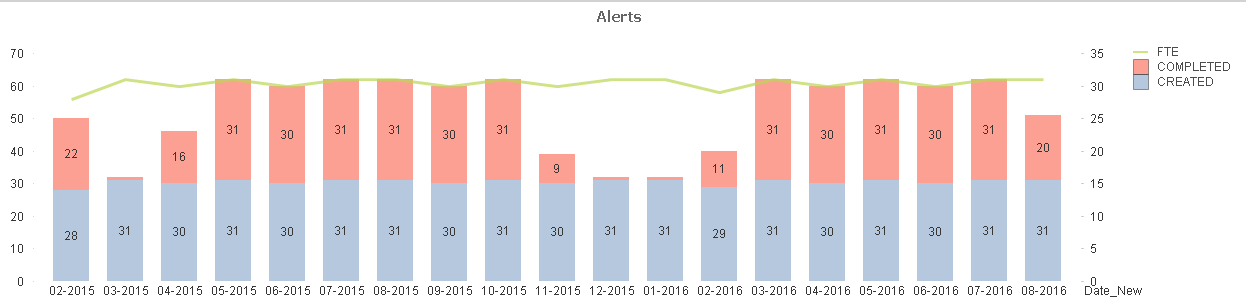
I would like to create this bar chart:
But my datatable is this way:
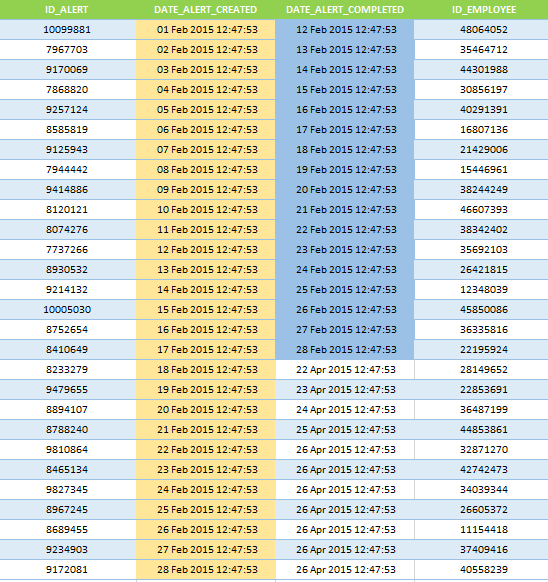
How can I create a Time dimension that is related to DATE_ALERT_CREATED and DATE_ALERT_COMPLETED at the same time as I want to show the created and completed alerts in the same graph on the same Time dimension.
I had initially created a Time dimension this way but I know it is wrong:
NEW_DATE:
LOAD
DATE_ALERT_CREATED,
Year(DATE_ALERT_CREATED) as Year,
Month(DATE_ALERT_CREATED) as Month,
Date(MakeDate(Year(DATE_ALERT_CREATED), Month(DATE_ALERT_CREATED)), 'MM-YYYY') as Date_New
Resident ALERT_TABLE;
I hope I was clear enough, looking forward to your help ! Thank you !
- Mark as New
- Bookmark
- Subscribe
- Mute
- Subscribe to RSS Feed
- Permalink
- Report Inappropriate Content
Look into this thread: