Unlock a world of possibilities! Login now and discover the exclusive benefits awaiting you.
- Qlik Community
- :
- All Forums
- :
- QlikView App Dev
- :
- Handling null values in bar chart with two dimensi...
- Subscribe to RSS Feed
- Mark Topic as New
- Mark Topic as Read
- Float this Topic for Current User
- Bookmark
- Subscribe
- Mute
- Printer Friendly Page
- Mark as New
- Bookmark
- Subscribe
- Mute
- Subscribe to RSS Feed
- Permalink
- Report Inappropriate Content
Handling null values in bar chart with two dimensions
Hello Everyone,
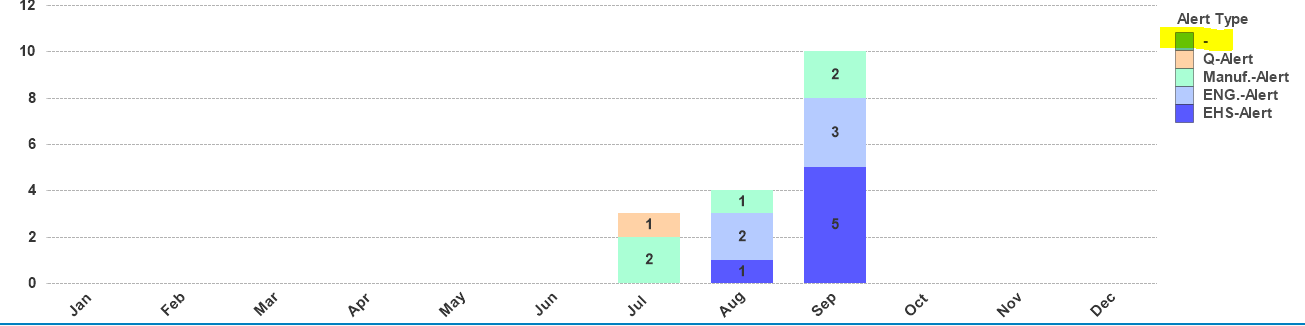
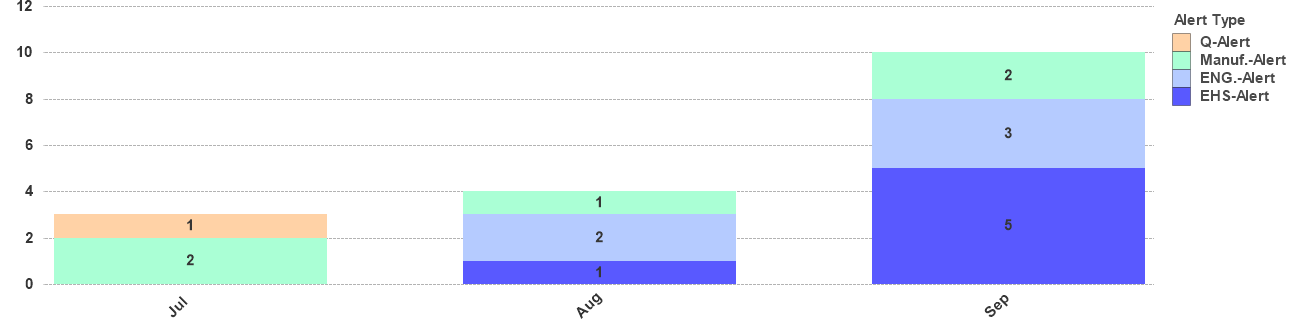
I have a bar chart with two dimensions and one expression. One dimension is "Month" and the other one say, "Type". I want the x-axis to display all the month values, though it might have null values. When I check the option "Suppress When Value is Null" for dimension, "Type", all months except which has data disappears. But when I uncheck this option, I see null to appear in the legend as shown in pictures below. I want to display all month values in x-axis and also don't want the null symbol to appear in the legend. How do I do this?
"Suppress When Value is Null" is unchecked
"Suppress When Value is Null" is checked
Any help?
Thank you.
- Mark as New
- Bookmark
- Subscribe
- Mute
- Subscribe to RSS Feed
- Permalink
- Report Inappropriate Content
Any help on this?