Unlock a world of possibilities! Login now and discover the exclusive benefits awaiting you.
- Qlik Community
- :
- All Forums
- :
- QlikView App Dev
- :
- Re: Heat map multiple dimensions value labels
- Subscribe to RSS Feed
- Mark Topic as New
- Mark Topic as Read
- Float this Topic for Current User
- Bookmark
- Subscribe
- Mute
- Printer Friendly Page
- Mark as New
- Bookmark
- Subscribe
- Mute
- Subscribe to RSS Feed
- Permalink
- Report Inappropriate Content
Heat map multiple dimensions value labels
Hi,
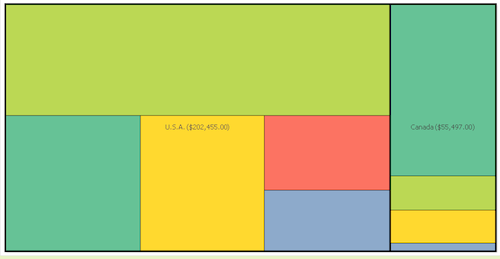
How can I show the value of a second dimension data point in a heat map? Say my first dimension is Country and my second dimension is Product, and my expression is Sum(Sales), how can I display the value label in the heat map chart for each product in each country.
It seems I can only show the value of the first dimension members.
Thanks in advance,
Regis
Accepted Solutions
- Mark as New
- Bookmark
- Subscribe
- Mute
- Subscribe to RSS Feed
- Permalink
- Report Inappropriate Content
- Mark as New
- Bookmark
- Subscribe
- Mute
- Subscribe to RSS Feed
- Permalink
- Report Inappropriate Content
Try with block chart. Of course you may define block colors by expression.
regards
Darek
- Mark as New
- Bookmark
- Subscribe
- Mute
- Subscribe to RSS Feed
- Permalink
- Report Inappropriate Content
Hi Dariuz,
I am already using a block chart. But as you can see, the labels only shows for the main block (corresponding to the first dimension: Country), but not the second dimension block. In the large green block, I would like to display: USA, Product 1, xxx
Thanks,
Regis
- Mark as New
- Bookmark
- Subscribe
- Mute
- Subscribe to RSS Feed
- Permalink
- Report Inappropriate Content

- Mark as New
- Bookmark
- Subscribe
- Mute
- Subscribe to RSS Feed
- Permalink
- Report Inappropriate Content
Thanks Dariuz,
I had to change the look to the one with the block header.
Regis