Unlock a world of possibilities! Login now and discover the exclusive benefits awaiting you.
- Qlik Community
- :
- All Forums
- :
- QlikView App Dev
- :
- Heatmap Formatting
- Subscribe to RSS Feed
- Mark Topic as New
- Mark Topic as Read
- Float this Topic for Current User
- Bookmark
- Subscribe
- Mute
- Printer Friendly Page
- Mark as New
- Bookmark
- Subscribe
- Mute
- Subscribe to RSS Feed
- Permalink
- Report Inappropriate Content
Heatmap Formatting
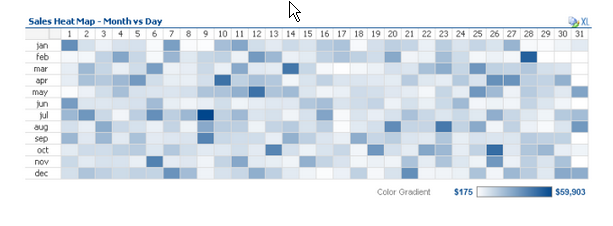
I try to achieve a nice heatmap, where I have the Time dimension on the x-axis and the Object ID on the y-axis. I found a similar solution but cannot access the code:
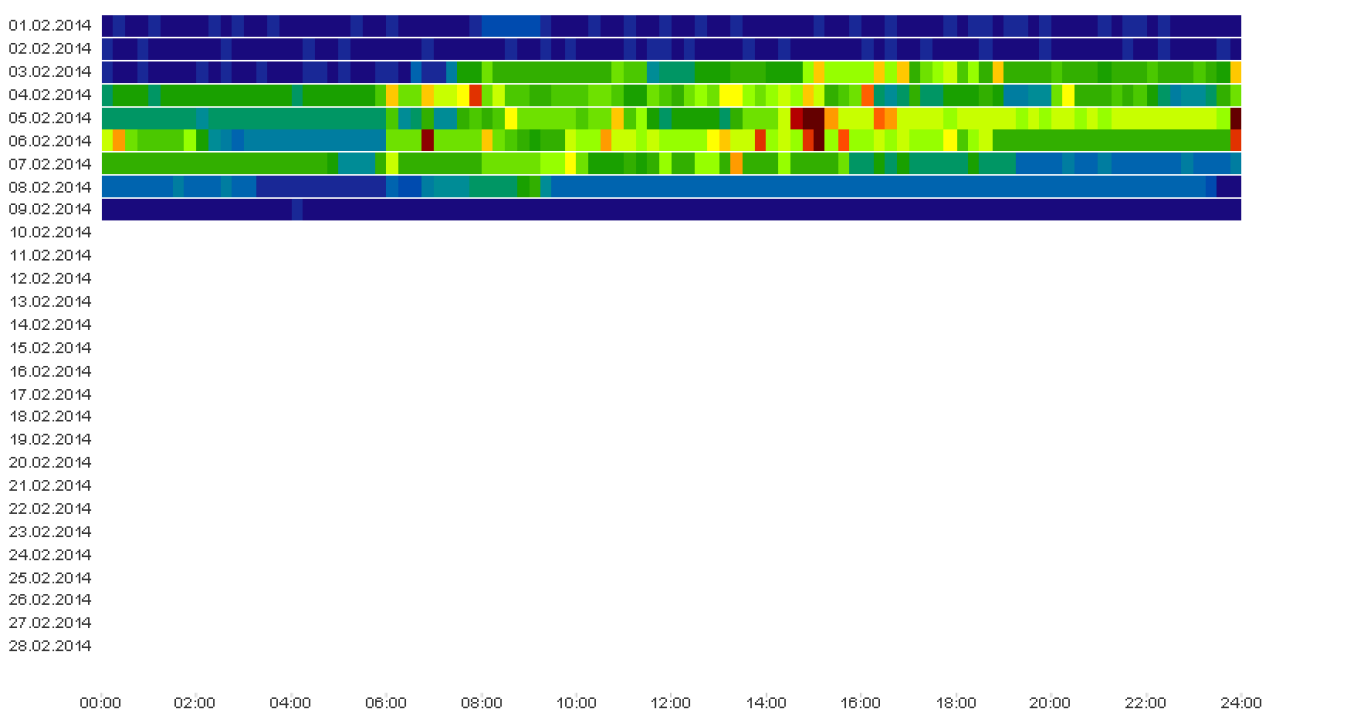
I tried this using pivot-table but could not get the timeline to the bottom nor could I just display every second step. If I try it by using a bar-char I cannot get the second expression to the y-axis. Any ideas how I can achieven this exact solution?
Thanks!
- Mark as New
- Bookmark
- Subscribe
- Mute
- Subscribe to RSS Feed
- Permalink
- Report Inappropriate Content
you can use round() or perhaps class() to bucket the time segments . Not sure why it doesn't extend to all dates.. i'd have to see the QVW sample.
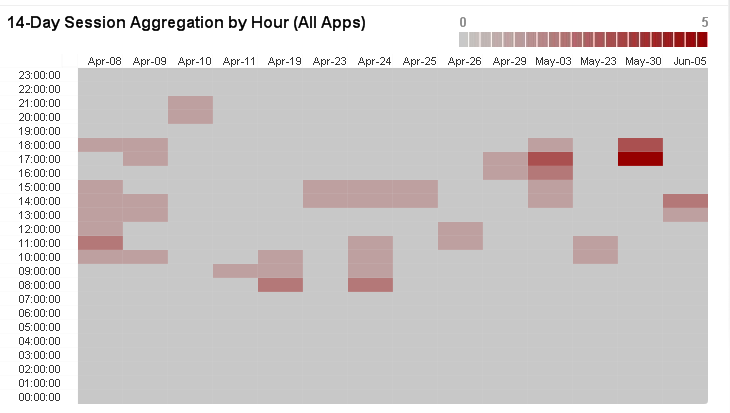
As far as samples go, the governance dashboard has a similar pivot table that provides a heat map to show when concurrency on the system gets high vs low.
Instead of date you would use minute but perhaps keep the hour calc.
Its a free utility on http://market.qlik.com so you can download it and view the code / QVW
- Mark as New
- Bookmark
- Subscribe
- Mute
- Subscribe to RSS Feed
- Permalink
- Report Inappropriate Content

- Mark as New
- Bookmark
- Subscribe
- Mute
- Subscribe to RSS Feed
- Permalink
- Report Inappropriate Content