Unlock a world of possibilities! Login now and discover the exclusive benefits awaiting you.
- Qlik Community
- :
- All Forums
- :
- QlikView App Dev
- :
- Help creating a Cross Table with Alternate States
- Subscribe to RSS Feed
- Mark Topic as New
- Mark Topic as Read
- Float this Topic for Current User
- Bookmark
- Subscribe
- Mute
- Printer Friendly Page
- Mark as New
- Bookmark
- Subscribe
- Mute
- Subscribe to RSS Feed
- Permalink
- Report Inappropriate Content
Help creating a Cross Table with Alternate States
We want to create a cross table that compares the same dimension over alternate states. We would like the result to be the following:
| 1 | Header 2 | Header 3 | Header 4 | Header 5 |
|---|---|---|---|---|
| [AlternateState2] DrugY | ||||
| S | R | I | ||
| [AlternateState1] DrugX | S | 47201 | 15936 | 3067 |
| R | 14204 | 34026 | 9559 | |
| I | 5490 | 1026 | 4002 |
Background:
We have a list of Drugs loaded into ClickView. Each drug has a breakdown of Interpretations (either S, R, or I). We use the following formula to give us a count of interpretations:
(aggr(count(interpretation), interpretation))
This yields the following list box:
DrugX
S — 24064
R — 12711
I — 4982
We’ve created 2 alternate states, allowing us to compare interpretations of 2 Drugs (we created a list box in each of the 2 states). We want to merge them into a cross table that shows the counts of both drugs. (See table above)
How would I go about this? We’re relatively new to QlikView and have already dedicated countless hours to finding a solution (with little results to show for it).
Thanks so much!
- Mark as New
- Bookmark
- Subscribe
- Mute
- Subscribe to RSS Feed
- Permalink
- Report Inappropriate Content
Hi
I recommend that you post a sample, or at least details of exactly how the table should work. If DrugX and DrugY are the same field on different axes, then I don't think that you can make an expression that refers to these two fields and understand the difference between them (and alternate states won't help you).
If you need some analysis like that, I would create a second Drug field which is a copy of the first. You could put these on both axes, refer to them individually in the expression, and if you then want to apply different selections to them, you could uses alternate states to achieve that.
HTH
Jonathan
- Mark as New
- Bookmark
- Subscribe
- Mute
- Subscribe to RSS Feed
- Permalink
- Report Inappropriate Content
Hello Seth,
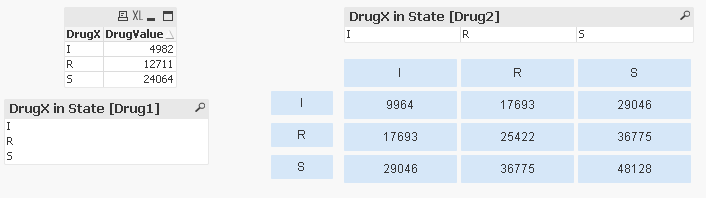
Here's a sample of a "simulated" cross-table, that is going to have a field perform a calculation against itself in an alternate state. However, it was not done in a chart object, but rather by sculpting out text box expressions that are laboriously set within each cell in a grid fashion (which is very taxing). It doesn't give you a full list of your values on both axes, but at least it gives you 3-floating slots on each axis to compare
It seems calculation of a field against its own alternate state is possible, but a chart expression that reaches outside the dimension to grab values against secondary dimensions that are exclusive, is still a missing component. Except I get this idea that if the calculation can be worked out in text boxes, then it's just a matter of figuring out what the proper chart dimension would be to get the whole thing working, but...
As Jonathan pointed out... making a clone of the field and placing that cloned field as the second dimension in a cross-table can solve your calculation requirement immediately.
However, if you want to keep pursuing it via only alternate states, at least here's something to start with.