Unlock a world of possibilities! Login now and discover the exclusive benefits awaiting you.
- Qlik Community
- :
- All Forums
- :
- QlikView App Dev
- :
- Re: Help in visualization with Rank and Pick
- Subscribe to RSS Feed
- Mark Topic as New
- Mark Topic as Read
- Float this Topic for Current User
- Bookmark
- Subscribe
- Mute
- Printer Friendly Page
- Mark as New
- Bookmark
- Subscribe
- Mute
- Subscribe to RSS Feed
- Permalink
- Report Inappropriate Content
Help in visualization with Rank and Pick
I have this application where I see fixed calculations using set analysis for a selected client.
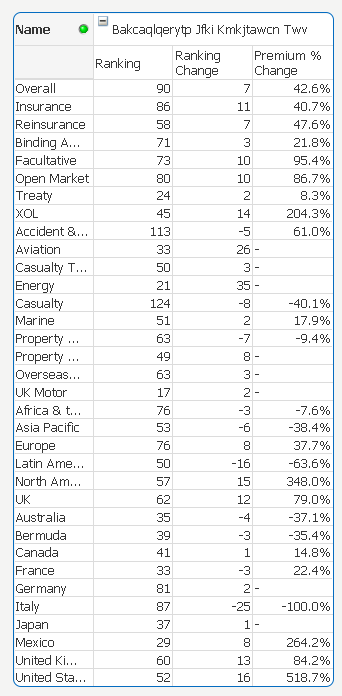
My problem is that I need to put client name on the top, instead of 3 dimension numbers used to format.
Something like this:
NAME
Ranking Rank Change Premium & Change
Overall 10 5 20%
Insurance 8 0 13%
Binding 25 18 -15%
Anyone can give me a hint please?
- « Previous Replies
-
- 1
- 2
- Next Replies »
- Mark as New
- Bookmark
- Subscribe
- Mute
- Subscribe to RSS Feed
- Permalink
- Report Inappropriate Content
Might as well do the whole thing 
- Mark as New
- Bookmark
- Subscribe
- Mute
- Subscribe to RSS Feed
- Permalink
- Report Inappropriate Content
The problem is that the Rank function is used for unpivoted ranking, whereas we need to use HRank for Horizontal ranking in a pivot table (when a certain dimension is pivoted) -> HRank ‒ QlikView. But not sure why, but I was running into issues using that. So in order to fool the chart into believing that we have not pivoted but using the Aggr function.
Also tried to fine tune your chart by removing the third dimension (text) and incorporated that into Dim using Pick() function.
- « Previous Replies
-
- 1
- 2
- Next Replies »