Unlock a world of possibilities! Login now and discover the exclusive benefits awaiting you.
Announcements
Join us to spark ideas for how to put the latest capabilities into action. Register here!
- Qlik Community
- :
- All Forums
- :
- QlikView App Dev
- :
- Re: Help needed creating a trending chart
Options
- Subscribe to RSS Feed
- Mark Topic as New
- Mark Topic as Read
- Float this Topic for Current User
- Bookmark
- Subscribe
- Mute
- Printer Friendly Page
Turn on suggestions
Auto-suggest helps you quickly narrow down your search results by suggesting possible matches as you type.
Showing results for
Not applicable
2016-02-04
12:56 PM
- Mark as New
- Bookmark
- Subscribe
- Mute
- Subscribe to RSS Feed
- Permalink
- Report Inappropriate Content
Help needed creating a trending chart
Hi
I have the following data:
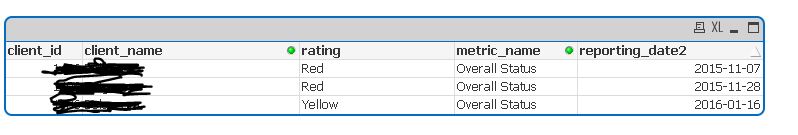
and I would like to have it displayed like this:
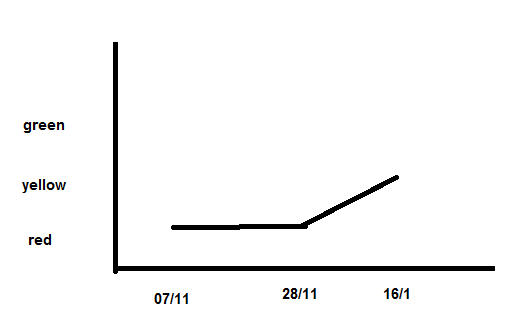
You know: rating on the left, timeline below and the trending. I want to show the changes of rating over time. I tried to create a trend chart but don't know what dimmensions and expressions to use. Please take into consideration there is a long list of clients. Probably all lines will be showed in the same chart, but that's ok.
Thanks for any help provided.
338 Views
1 Solution
Accepted Solutions
MVP
2016-02-04
09:10 PM
- Mark as New
- Bookmark
- Subscribe
- Mute
- Subscribe to RSS Feed
- Permalink
- Report Inappropriate Content
Something like this?
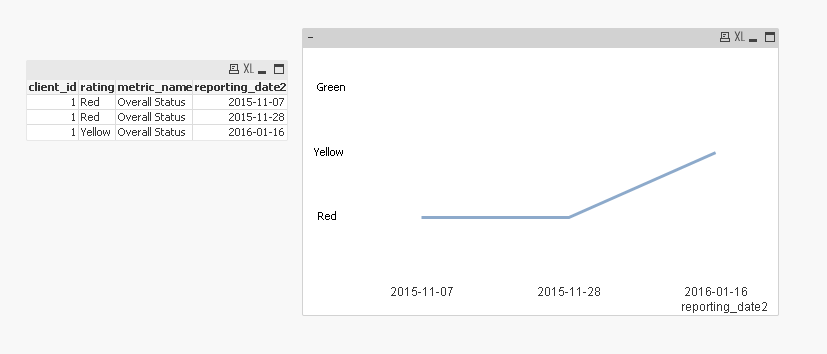
Dimension: reporting_date2
Expression: =Match(rating, 'Red', 'Yellow', 'Green')
1 Reply
MVP
2016-02-04
09:10 PM
- Mark as New
- Bookmark
- Subscribe
- Mute
- Subscribe to RSS Feed
- Permalink
- Report Inappropriate Content
Something like this?
Dimension: reporting_date2
Expression: =Match(rating, 'Red', 'Yellow', 'Green')