Unlock a world of possibilities! Login now and discover the exclusive benefits awaiting you.
- Qlik Community
- :
- All Forums
- :
- QlikView App Dev
- :
- Re: Help regarding carryon count of tickets
- Subscribe to RSS Feed
- Mark Topic as New
- Mark Topic as Read
- Float this Topic for Current User
- Bookmark
- Subscribe
- Mute
- Printer Friendly Page
- Mark as New
- Bookmark
- Subscribe
- Mute
- Subscribe to RSS Feed
- Permalink
- Report Inappropriate Content
Help regarding carryon count of tickets
Hi All,
in the attached sheet there are fields ticket number, created date and resolved date and ticket status
my requirement is
lets says total tickets raised in a month is 100 and 12 of them is resolved by last day of that month the carry forward should be 88 that has to be added to the tickets on the month start of next month and it has to go on
can we achieve something like that ,
Thanks in Advance
- Tags:
- qlikview_scripting
- « Previous Replies
-
- 1
- 2
- Next Replies »
- Mark as New
- Bookmark
- Subscribe
- Mute
- Subscribe to RSS Feed
- Permalink
- Report Inappropriate Content
You could look into creating reference dates for each date in the interval between creation and closure of a ticket, like shown in
Creating Reference Dates for Intervals
The reference date table should show the granularity that is required for your reports, dates when you need a count of open tickets per date or maybe months if you only need the count per month.
- Mark as New
- Bookmark
- Subscribe
- Mute
- Subscribe to RSS Feed
- Permalink
- Report Inappropriate Content
Hi swuehl ,
I am not able figure out how can do this ,i fyou have free time can you please make try with the sample data i attached .
Thanks Again .
- Mark as New
- Bookmark
- Subscribe
- Mute
- Subscribe to RSS Feed
- Permalink
- Report Inappropriate Content
It should be something like
Tickets:
LOAD ticket_id,
CreatedDateText,
Ticket_ResolveDate,
ticket_status,
Alt(Ticket_ResolveDate,Today()) as EndDate
FROM
[commhelp.xls]
(biff, embedded labels, table is Sheet1$);
ReferenceDates:
LOAD ticket_id,
Date(CreatedDateText+iterno()-1) as ReferenceDate
RESIDENT Tickets
WHILE CreatedDateText+iterno()-1 <= EndDate;
Then use ReferenceDate as dimenion e.g. in a bar chart and
=Count(DISTINCT ticket_id)
as expression to count the open tickets.
- Mark as New
- Bookmark
- Subscribe
- Mute
- Subscribe to RSS Feed
- Permalink
- Report Inappropriate Content
Hi
i fear that i didnt explained correctly what my requirement is
i would like to explain again 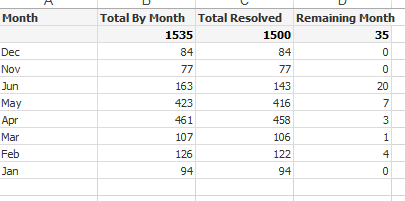
in the above pic total tickets raised on that particular month dec are 84 and total of tickets that got resolved are 84 but this does not mean that all the tickets that are raised in dec are resolved the tickets that have been raised before December might get resolved in dec
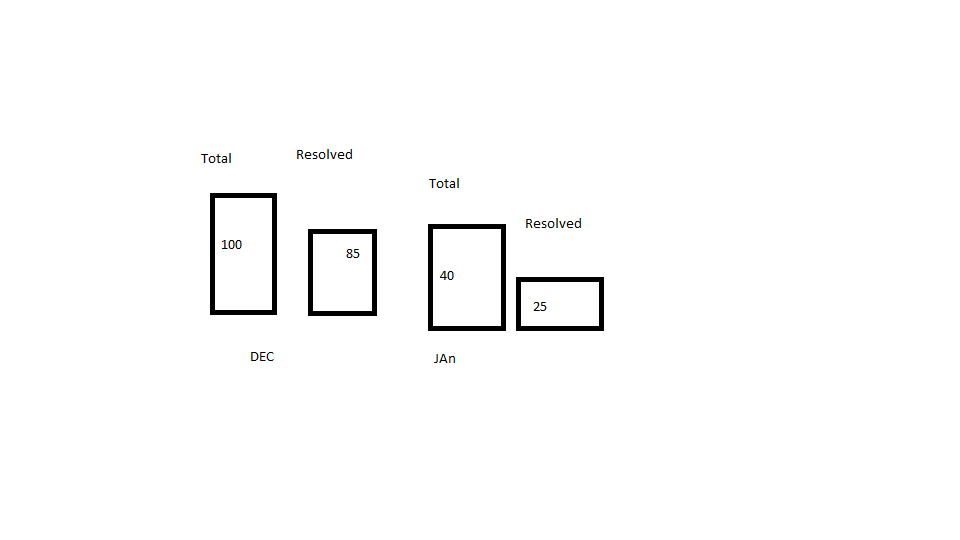
so my requirement is lets say in the month DEC 100 tickets are been raised and 85 of them are resolved by the monthend of DEC on ,and 25 tickets are raised in JAN and ten of them got resolved by the month end of jan
i want to plot a graph in Bar chat like this ,Hope this explains my requirement
- Mark as New
- Bookmark
- Subscribe
- Mute
- Subscribe to RSS Feed
- Permalink
- Report Inappropriate Content
For example, you can create flags in the table with reference dates to indicate creation and closing dates.
Then you can easily count creation or closing of tickets next to your open count.
- Mark as New
- Bookmark
- Subscribe
- Mute
- Subscribe to RSS Feed
- Permalink
- Report Inappropriate Content
i read the the whole article , but i am unable to apply it here  ,
,
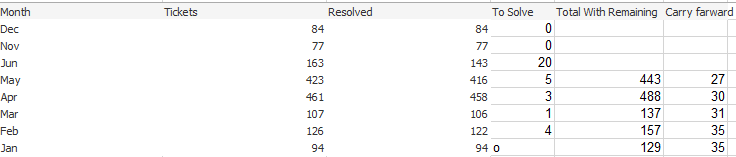
my total ticets on every months has to be same as Total With Remaining (total tickets raised on that month +carryfarward tickets from lastmonth) ,can you try to attach an app if possible ,sorry to ask in weekends
- Mark as New
- Bookmark
- Subscribe
- Mute
- Subscribe to RSS Feed
- Permalink
- Report Inappropriate Content
Using the script from the other thread and some UI chart objects:
![2016-06-27 01_06_58-QlikView x64 - [C__Users_Stefan_Downloads_comm222092.qvw].png](/legacyfs/online/129209_2016-06-27 01_06_58-QlikView x64 - [C__Users_Stefan_Downloads_comm222092.qvw].png)
- Mark as New
- Bookmark
- Subscribe
- Mute
- Subscribe to RSS Feed
- Permalink
- Report Inappropriate Content
we are almost there but when i check the total tickets that are open it is showing me as 35 where as the logic we implemented is giving us 31 , so we are missing four tickets here
- Mark as New
- Bookmark
- Subscribe
- Mute
- Subscribe to RSS Feed
- Permalink
- Report Inappropriate Content
We are not missing any tickets.
The 35 tickets are giving the number of tickets that were open any time in the selected time frame, in your example, 35 are the total number of distinct ticket_id.
The 31 tickets are the giving the number of tickets at the end of your selected time frame (end of June 2016).
There is a difference of four tickets, because 4 tickets have been closed in Apr/May/June 2016.
- « Previous Replies
-
- 1
- 2
- Next Replies »