Unlock a world of possibilities! Login now and discover the exclusive benefits awaiting you.
- Qlik Community
- :
- All Forums
- :
- QlikView App Dev
- :
- Help required to create complicated chart
- Subscribe to RSS Feed
- Mark Topic as New
- Mark Topic as Read
- Float this Topic for Current User
- Bookmark
- Subscribe
- Mute
- Printer Friendly Page
- Mark as New
- Bookmark
- Subscribe
- Mute
- Subscribe to RSS Feed
- Permalink
- Report Inappropriate Content
Help required to create complicated chart
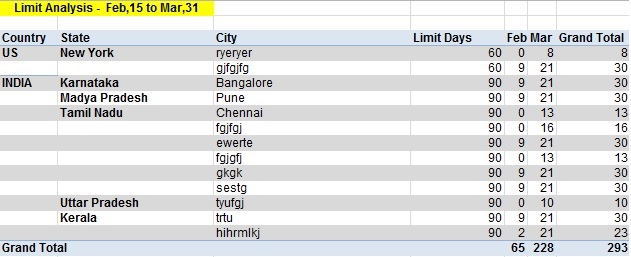
I want to create a chart something like below one. The values that you see is the count of TRUE value against the each city for the selected date range(Based on the date range you have more number of month columns dynamically). It should count the number against each city based on the below expressions.
IF(
IF(Limit_Days='l_30',[30 days],
IF(Limit_Days='l_60',[60 days],
IF(Limit_Days='l_90',[90 days],
IF(Limit_Days='TBD',[60 days)
)
)
)<1
,sum(TOTAL{<Period = {'>$(=date($(VMaxPeriod)-$(VDays))) <=$(=date($(VMaxPeriod))) '}>} 1),
sum(TOTAL{<Period = {'>$(=date($(VMaxPeriod)-$(VDays))) <=$(=date($(VMaxPeriod))) '}>} 0))
Has anyone created a similar chart like this? Can you please help on the same since it doesn't looks to be straight forward.
- Tags:
- pivot table format
- « Previous Replies
-
- 1
- 2
- Next Replies »
- Mark as New
- Bookmark
- Subscribe
- Mute
- Subscribe to RSS Feed
- Permalink
- Report Inappropriate Content
Any update from anyone on this?
- Mark as New
- Bookmark
- Subscribe
- Mute
- Subscribe to RSS Feed
- Permalink
- Report Inappropriate Content
Some how I have managed to count number of TRUE value for a month using below expression and by adding Month in the dimension. But the issue here is when there is no TRUE value exists it has display 0 but in my case it is not displaying any records. Please help me out on this?
=Sum(Aggr(IF(
IF(maxstring({<$(e_DateRange)>}Limit_Days)='last_30',$(e_Days('l_30')),
IF(maxstring({<$(e_DateRange)>}Limit_Days)='last_60',$(e_Days('l_60')),
IF(maxstring({<$(e_DateRange)>}Limit_Days)='last_90',$(e_Days('l_90')),
IF(maxstring({<$(e_DateRange)>}Limit_Days)='TBD',$(e_Days('l_60')))
)
)
)<1
,1, 0 ),Period))
- « Previous Replies
-
- 1
- 2
- Next Replies »