Unlock a world of possibilities! Login now and discover the exclusive benefits awaiting you.
- Qlik Community
- :
- All Forums
- :
- QlikView App Dev
- :
- Re: Help required to create scatter chart with mul...
- Subscribe to RSS Feed
- Mark Topic as New
- Mark Topic as Read
- Float this Topic for Current User
- Bookmark
- Subscribe
- Mute
- Printer Friendly Page
- Mark as New
- Bookmark
- Subscribe
- Mute
- Subscribe to RSS Feed
- Permalink
- Report Inappropriate Content
Help required to create scatter chart with multiple dimension excel file attached
Hi All,
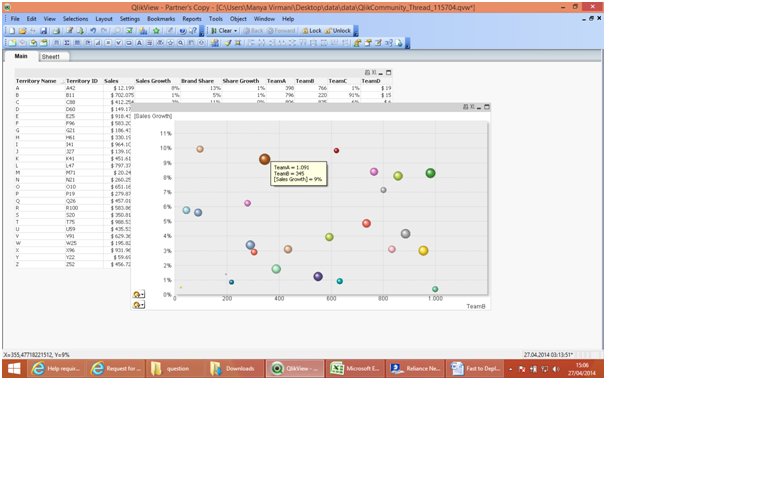
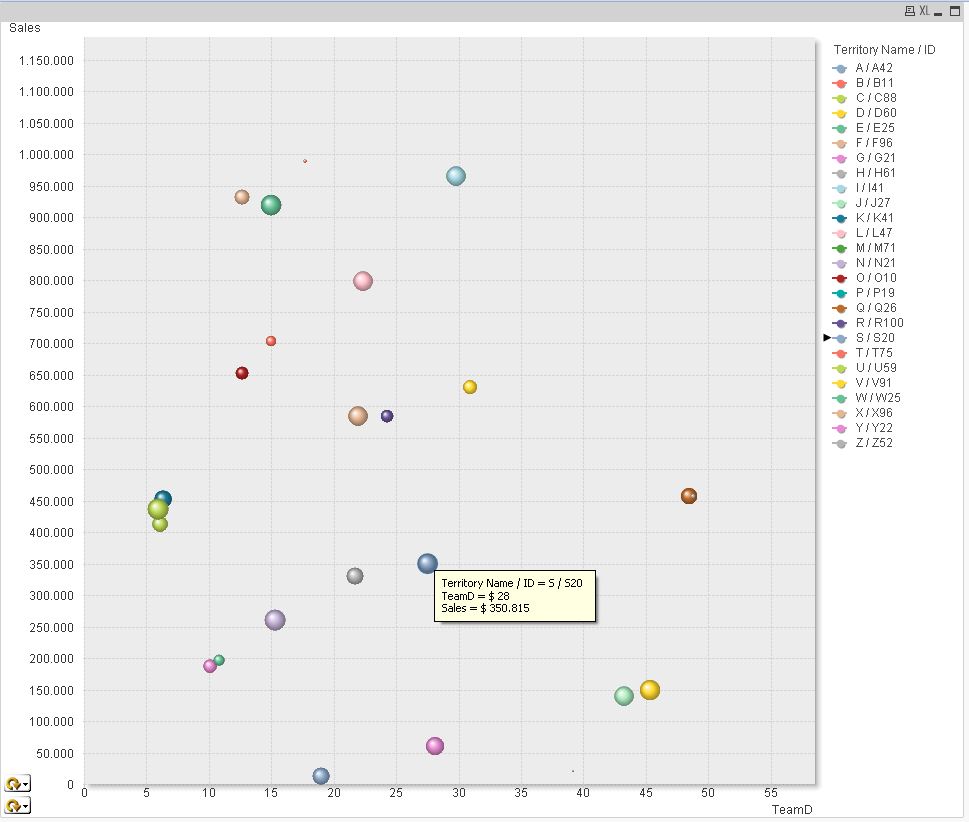
I am a bit confused and required your help to create a X Y Scatter chart.In the X axis we have to show 4 team and in Y axis we have to show 3 fields.Excel attached for the example. Please suggest the solutions.
- Tags:
- new_to_qlikview
- « Previous Replies
-
- 1
- 2
- Next Replies »
- Mark as New
- Bookmark
- Subscribe
- Mute
- Subscribe to RSS Feed
- Permalink
- Report Inappropriate Content
Hi Manish,
one solution could be:
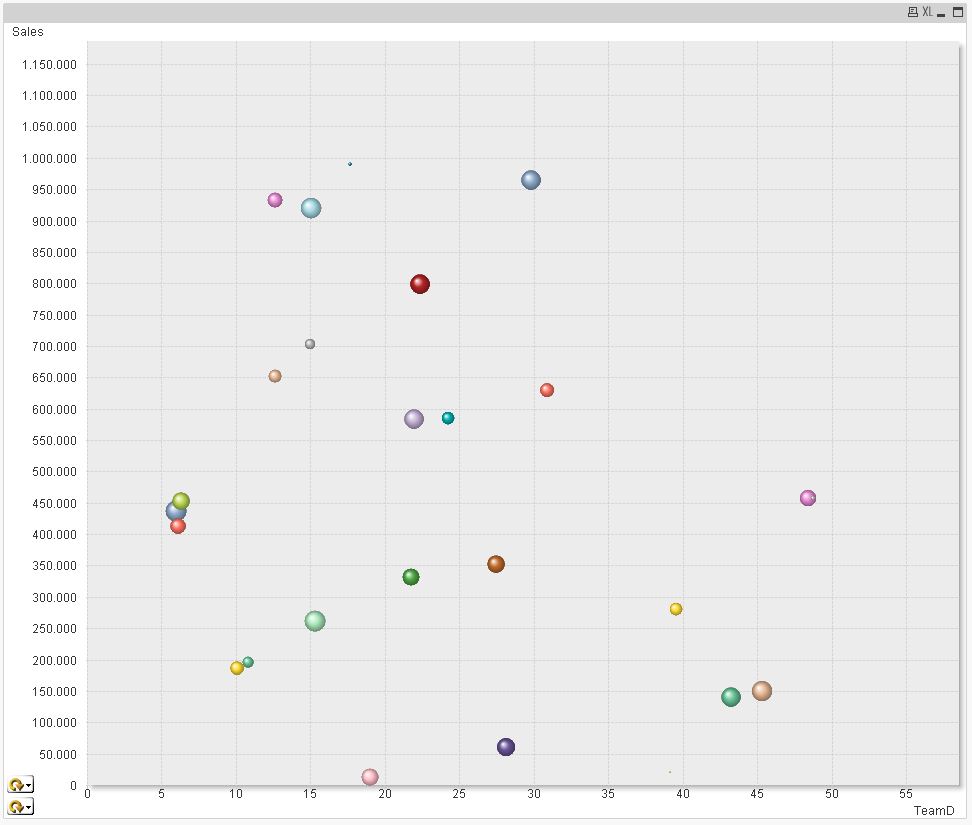
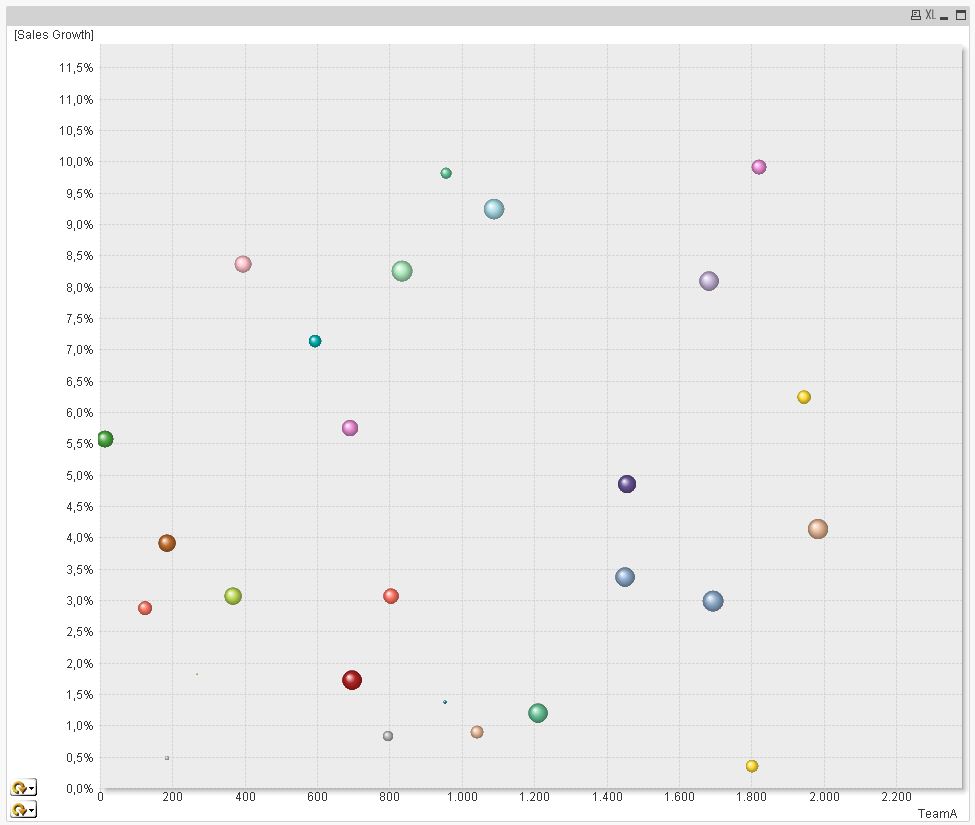
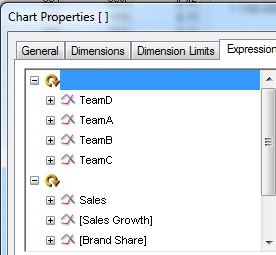
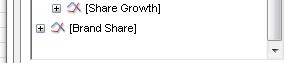
You can use expression grouping instead of dimension grouping in this case
hope this helps
regards
Marco
- Mark as New
- Bookmark
- Subscribe
- Mute
- Subscribe to RSS Feed
- Permalink
- Report Inappropriate Content
Thanks Marco!!
Yes, i am looking for this type of solution. This is great.
Please share the qlikview file.
Thanks
Manish Virmani
- Mark as New
- Bookmark
- Subscribe
- Mute
- Subscribe to RSS Feed
- Permalink
- Report Inappropriate Content
It's already attached.
Regards
Marco
- Mark as New
- Bookmark
- Subscribe
- Mute
- Subscribe to RSS Feed
- Permalink
- Report Inappropriate Content
 Hi Marco,
Please let me know when I selecting team B and taking cursor to bubble, it is showing value of Team A and Team B. Shouldn't it should show team B, because I have selected teamB.
- Mark as New
- Bookmark
- Subscribe
- Mute
- Subscribe to RSS Feed
- Permalink
- Report Inappropriate Content
Hi,
I erroneously used the wrong dimension.
Here's a new version:
regards
Marco
- « Previous Replies
-
- 1
- 2
- Next Replies »