Unlock a world of possibilities! Login now and discover the exclusive benefits awaiting you.
- Qlik Community
- :
- All Forums
- :
- QlikView App Dev
- :
- Help with Complex Expression
- Subscribe to RSS Feed
- Mark Topic as New
- Mark Topic as Read
- Float this Topic for Current User
- Bookmark
- Subscribe
- Mute
- Printer Friendly Page
- Mark as New
- Bookmark
- Subscribe
- Mute
- Subscribe to RSS Feed
- Permalink
- Report Inappropriate Content
Help with Complex Expression
Hi everyone,
I am struggling to create the following expression to be used in a chart.
I have a concatenated fact table which consists of Sales (record type 'SA') and First Sales Date (record type 'FS') which consists of a date when the customer had the first sale.
I want to create an expression where I get the total Sales for the month where the customers had the first Sales.
For ex for April 2016:
Total Sales in month $15,000
No of First Customers 230
Total Sales from first customers $8,500 (therefore Sales from returning customers $6,500)
I wrote the following expression:
=SUM({<AccountID=P({<Type={'FS'>}) >} Sales)
however the above will give me the sales of months 5,6,7, etc.. for the customers who came first active in Month 4, and not sales for just month 4.
Can anyone help me in this please?
I want to somehow achive the following condition
=SUM({<AccountID=P({<Type={'FS'}, Month_Number_Year={'4'}>} ), Month_Number_Year={'4'}>} Sales)
Many thanks for your help,
Jon
Message was edited by: Jonathan Mallia
- « Previous Replies
-
- 1
- 2
- Next Replies »
Accepted Solutions
- Mark as New
- Bookmark
- Subscribe
- Mute
- Subscribe to RSS Feed
- Permalink
- Report Inappropriate Content
I think the two expressions are different ways to reach same result but can vary based on your actual data. In your case if both the expressions are working, I would suggest you to use your own expression as it is simpler and require a smaller aggregation.
HTH
Best,
Sunny
- Mark as New
- Bookmark
- Subscribe
- Mute
- Subscribe to RSS Feed
- Permalink
- Report Inappropriate Content
Do you get the output right with your last expression, i.e =SUM({<AccountID=P({<Type={'FS'}, Month_Number_Year={'4'}>} ), Month_Number_Year={'4'}>} Sales) ?
Could you post a sample qvw?
- Mark as New
- Bookmark
- Subscribe
- Mute
- Subscribe to RSS Feed
- Permalink
- Report Inappropriate Content
Yes the last expression gives me the correct output because it returns the customers who had type FS in month 4, and Sales of month 4.
Thanks
- Mark as New
- Bookmark
- Subscribe
- Mute
- Subscribe to RSS Feed
- Permalink
- Report Inappropriate Content
So you are probably trying to make it dynamic by setting a formula for '4'. Am I right? If so, please tell your logic in detail how you decide on '4' ? Perhaps a sample qvw with sample data ?
- Mark as New
- Bookmark
- Subscribe
- Mute
- Subscribe to RSS Feed
- Permalink
- Report Inappropriate Content
What I need is something based on
=SUM({<AccountID=P({<Type={'FS'>}) >} Sales)
to be shown in a chart - a chart which shows the total sales from first time customers. The Dimension on this chart is simply Month.
- Mark as New
- Bookmark
- Subscribe
- Mute
- Subscribe to RSS Feed
- Permalink
- Report Inappropriate Content
Hi Tresesco,
Did you manage to get hold of the sample app?
Thanks
- Mark as New
- Bookmark
- Subscribe
- Mute
- Subscribe to RSS Feed
- Permalink
- Report Inappropriate Content
May be looking to get this?
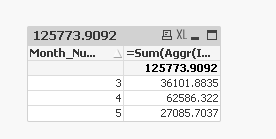
Expression
=Sum(Aggr(If(AccountBrandID = Above(AccountBrandID) and Above(Type) = 'FS', Sum(Deposits)), Month_Number_Year, AccountBrandID, Type))
- Mark as New
- Bookmark
- Subscribe
- Mute
- Subscribe to RSS Feed
- Permalink
- Report Inappropriate Content
Hi Sunny,
Thanks for the above. The Value for April should be 25,830 however. The April value in the chart should be the same as when selecting Apr from the top list.
- Mark as New
- Bookmark
- Subscribe
- Mute
- Subscribe to RSS Feed
- Permalink
- Report Inappropriate Content
Hi everyone,
So after a while it looks like the below works...
Sum
(
Aggr( IF(COUNT(DISTINCT Type) = 2, SUM(Deposits),0), AccountBrandID, Month_Name_Abbreviation)
)
Anyone can confirm this and ensure it works in all scenarios?
- Mark as New
- Bookmark
- Subscribe
- Mute
- Subscribe to RSS Feed
- Permalink
- Report Inappropriate Content
Both our expressions are giving the same values. Not sure what difference did you find?
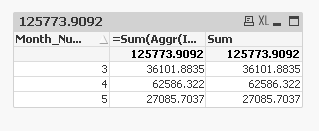
1st expression is mind and second one is yours
- « Previous Replies
-
- 1
- 2
- Next Replies »