Unlock a world of possibilities! Login now and discover the exclusive benefits awaiting you.
- Qlik Community
- :
- All Forums
- :
- QlikView App Dev
- :
- Help with an expression for a gauge chart
- Subscribe to RSS Feed
- Mark Topic as New
- Mark Topic as Read
- Float this Topic for Current User
- Bookmark
- Subscribe
- Mute
- Printer Friendly Page
- Mark as New
- Bookmark
- Subscribe
- Mute
- Subscribe to RSS Feed
- Permalink
- Report Inappropriate Content
Help with an expression for a gauge chart
Hi,
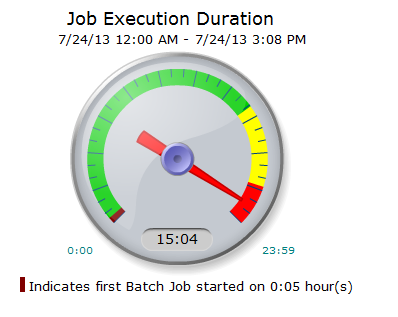
I am trying to create a gauge to display how long jobs take to run. There would be one gauge per job. It should look similar to the attached image.
I have a Start_Date field that stores the start date and time of jobs and an End_Time field that stores the end date and time of jobs.
The range for the gauge should start at 5 p.m. on the prior day (7/29) and finish at 5 a.m. the current day (7/30).
I’m unclear on what my expression should be. I need to identify what the job should be but this expression does not return any data:
$({<collct_id={'1'}>}End_Time)
An example would be if a job started at 7/29/2013 at 6:12:12 PM and finished at 7/30/2013 1:20:00 AM I would need the duration to be 7 hours, 7 minutes and 58 seconds and the needle to show this.
Any help would be greatly appreciated.
- Mark as New
- Bookmark
- Subscribe
- Mute
- Subscribe to RSS Feed
- Permalink
- Report Inappropriate Content
Please disregard. I've asked around and it doesn't sound like this is possible using a gauge chart. I'm going to go with a Gantt chart instead. I found a great article on this in the QV Development Blog:
http://community.qlik.com/blogs/qlikviewdesignblog/2012/06/01/recipe-for-gantt-chart