Unlock a world of possibilities! Login now and discover the exclusive benefits awaiting you.
- Qlik Community
- :
- All Forums
- :
- QlikView App Dev
- :
- Help with bar chart for legends, bar colors, axis ...
- Subscribe to RSS Feed
- Mark Topic as New
- Mark Topic as Read
- Float this Topic for Current User
- Bookmark
- Subscribe
- Mute
- Printer Friendly Page
- Mark as New
- Bookmark
- Subscribe
- Mute
- Subscribe to RSS Feed
- Permalink
- Report Inappropriate Content
Help with bar chart for legends, bar colors, axis step size
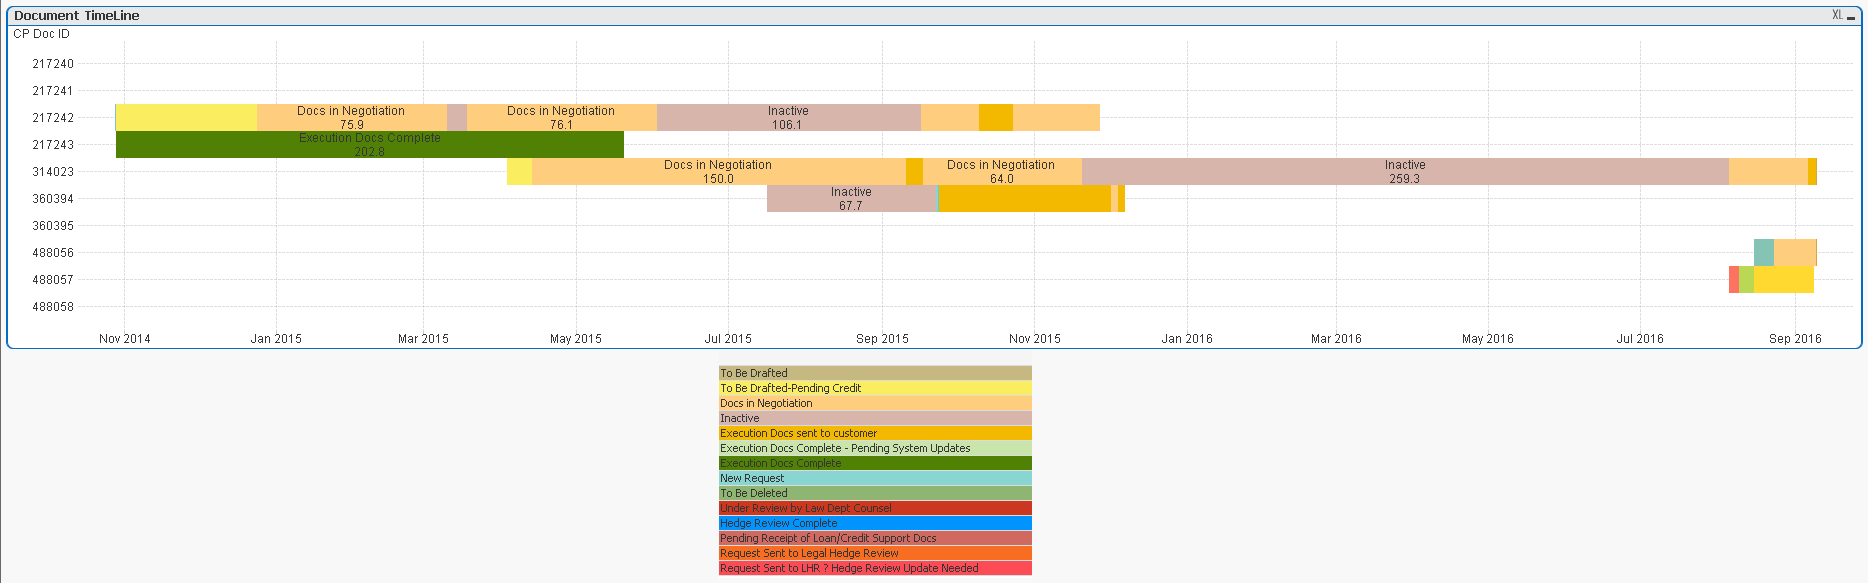
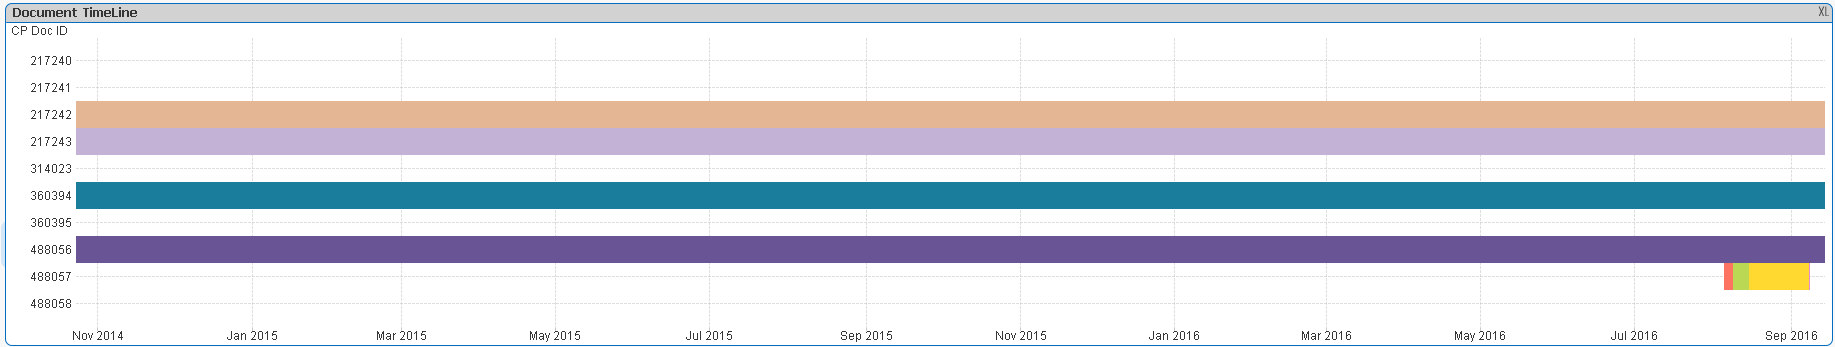
I've created horizontal bar chart that is like a timeline. I've included data file (use data found on tab "RestructuredHistData")
I will like to get help/guidance on following items
- Will like to get bar colors based on [TL Event] instead of [TL Sequence] dimension
- number displayed in bar to be in rounded to 1 decimal place (I've tried using Num,Num#, Floor, Round functions but couldn't get either of them to work, always shows - for all bar, may be I'm not using them correctly)
- Legends to be shown for [TL Event] and not [TL Sequence]
- will it be possible to dynamically control step size based on may be start and end and dividing it somehow to show more intervals, for example in screen shot included I'm thinking of having interval of one month instead of default two months
- In pop-up text is it possible to not display TL Sequence (line 2 ), Duration (line 3) as seen in screen shot
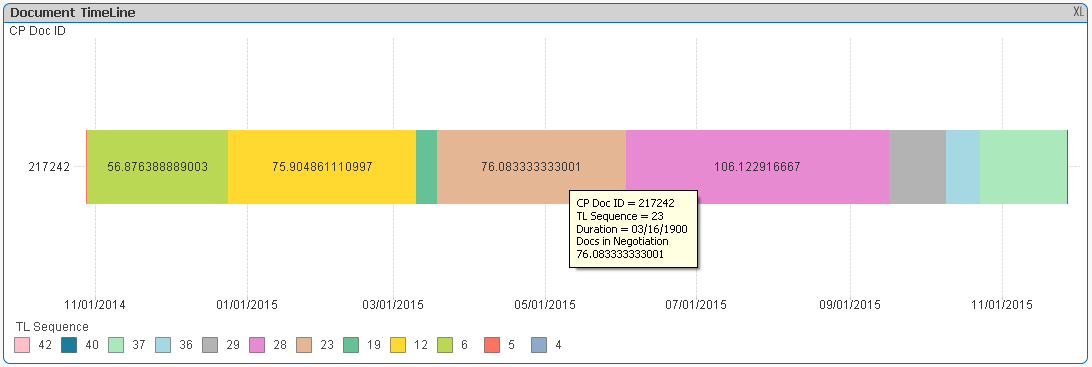
Chart related information
Chart Dimensions:
[Counterparty Document: Document ID]
[TL Sequence] (wanted to use [TL Event] but some of the bars would not show up due to repetitive nature of information in data and expression used)
Bar Expression:
=Max({<[Counterparty Document: Document ID], [TL Sequence]>}[TL End Date Time]) - Min({<[Counterparty Document: Document ID], [TL Sequence]>}[TL Start Date Time])
Bar Offset:
date(
if(IsNull(above(Only([Counterparty Document: Document ID]))), Min({<[Counterparty Document: Document ID], [TL Sequence]>}[TL Start Date Time]),
RangeMax(0,Min({<[Counterparty Document: Document ID], [TL Sequence]>}[TL Start Date Time])-RangeMax(above(Max({<[Counterparty Document: Document ID], [TL Sequence]>}[TL End Date Time]),1,rowno()-1))))
)
Duration calculation that is displayed in Bar and pop-up text
=Time#(Interval#(Max({<[Counterparty Document: Document ID], [TL Sequence]>}[TL End Date Time]) - Min({<[Counterparty Document: Document ID], [TL Sequence]>}[TL Start Date Time]), 'D HH:MM'),'##.#')
Accepted Solutions
- Mark as New
- Bookmark
- Subscribe
- Mute
- Subscribe to RSS Feed
- Permalink
- Report Inappropriate Content
I found solution to some of the question I had posted.
Bar coloring. I had an expression error in conditional coloring.
Rounding of Numbers displayed in bar worked once I applied the calculation in all relevant expressions on the chart.
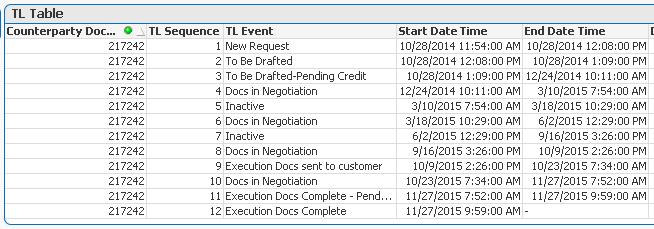

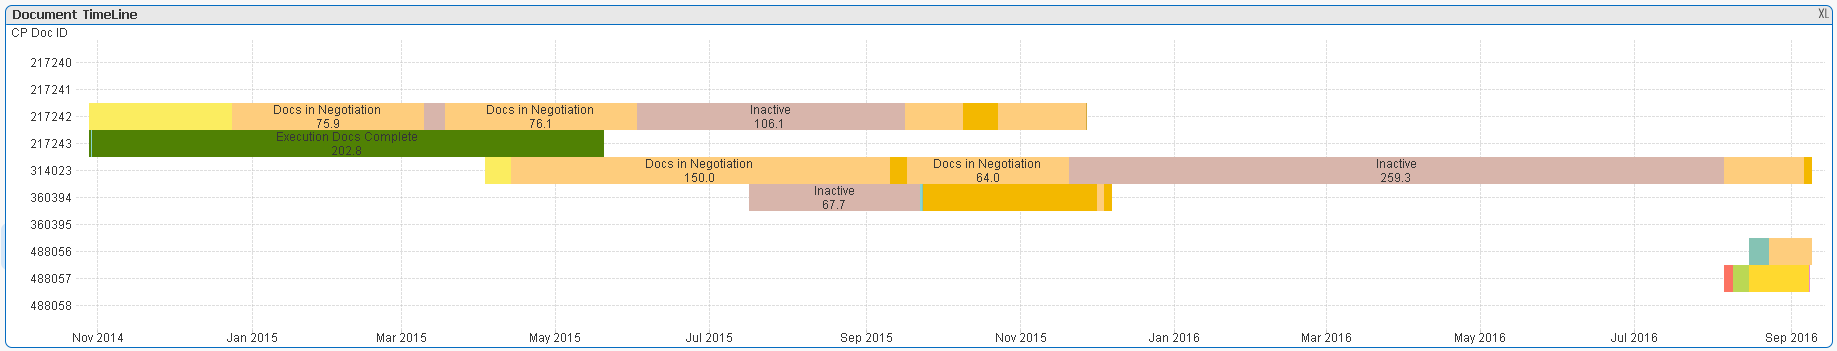
Chart Dimensions
Counterparty Document: Document ID
TL Sequence
BarExpression
=Num(Max({<[Counterparty Document: Document ID], [TL Sequence]>}[TL End Date Time]) - Min({<[Counterparty Document: Document ID], [TL Sequence]>}[TL Start Date Time]),'#.#')
BarOffset
date(
if(IsNull(above(Only([Counterparty Document: Document ID]))), Min({<[Counterparty Document: Document ID], [TL Sequence]>}[TL Start Date Time]),
RangeMax(0,Min({<[Counterparty Document: Document ID], [TL Sequence]>}[TL Start Date Time])-RangeMax(above(Max({<[Counterparty Document: Document ID], [TL Sequence]>}[TL End Date Time]),1,rowno()-1))))
)
Background Color for Bars
If([TL Event] = 'New Request', RGB(136, 213, 210),
If([TL Event] = 'To Be Drafted', RGB(133, 195, 180),
If([TL Event] = 'To Be Drafted-Pending Credit', RGB(251, 237, 96),
If([TL Event] = 'Docs in Negotiation', RGB(254, 205, 125),
If([TL Event] = 'Inactive', RGB(216, 181, 171),
If([TL Event] = 'Execution Docs sent to customer', RGB(243, 184, 0),
If([TL Event] = 'Execution Docs Complete - Pending System Updates', RGB(210, 168, 62),
If([TL Event] = 'Execution Docs Complete', RGB(80, 129, 4),
))))))))
Axes
=Min({<[Counterparty Document: Document ID]>}[TL Start Date Time]) - 5
=Max({<[Counterparty Document: Document ID]>}[TL End Date Time]) + 5
Items still pending are
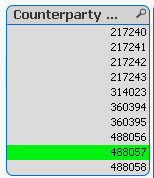
- Legends to be shown based TL Event that is not a selected dimension in the chart. First two columns from data screen shots are selected dimensions in the chart
- Will it be possible to dynamically control step size based on may be start and end and dividing it somehow to show more intervals, for example in screen shot included I'm thinking of having interval of one month instead of default two months
- In pop-up text is it possible to not display TL Sequence (line 2 ), Duration (line 3) as seen in screen shot
- Now I want to get chart to display selected document instead of all documents
- Mark as New
- Bookmark
- Subscribe
- Mute
- Subscribe to RSS Feed
- Permalink
- Report Inappropriate Content
I found solution to some of the question I had posted.
Bar coloring. I had an expression error in conditional coloring.
Rounding of Numbers displayed in bar worked once I applied the calculation in all relevant expressions on the chart.
Chart Dimensions
Counterparty Document: Document ID
TL Sequence
BarExpression
=Num(Max({<[Counterparty Document: Document ID], [TL Sequence]>}[TL End Date Time]) - Min({<[Counterparty Document: Document ID], [TL Sequence]>}[TL Start Date Time]),'#.#')
BarOffset
date(
if(IsNull(above(Only([Counterparty Document: Document ID]))), Min({<[Counterparty Document: Document ID], [TL Sequence]>}[TL Start Date Time]),
RangeMax(0,Min({<[Counterparty Document: Document ID], [TL Sequence]>}[TL Start Date Time])-RangeMax(above(Max({<[Counterparty Document: Document ID], [TL Sequence]>}[TL End Date Time]),1,rowno()-1))))
)
Background Color for Bars
If([TL Event] = 'New Request', RGB(136, 213, 210),
If([TL Event] = 'To Be Drafted', RGB(133, 195, 180),
If([TL Event] = 'To Be Drafted-Pending Credit', RGB(251, 237, 96),
If([TL Event] = 'Docs in Negotiation', RGB(254, 205, 125),
If([TL Event] = 'Inactive', RGB(216, 181, 171),
If([TL Event] = 'Execution Docs sent to customer', RGB(243, 184, 0),
If([TL Event] = 'Execution Docs Complete - Pending System Updates', RGB(210, 168, 62),
If([TL Event] = 'Execution Docs Complete', RGB(80, 129, 4),
))))))))
Axes
=Min({<[Counterparty Document: Document ID]>}[TL Start Date Time]) - 5
=Max({<[Counterparty Document: Document ID]>}[TL End Date Time]) + 5
Items still pending are
- Legends to be shown based TL Event that is not a selected dimension in the chart. First two columns from data screen shots are selected dimensions in the chart
- Will it be possible to dynamically control step size based on may be start and end and dividing it somehow to show more intervals, for example in screen shot included I'm thinking of having interval of one month instead of default two months
- In pop-up text is it possible to not display TL Sequence (line 2 ), Duration (line 3) as seen in screen shot
- Now I want to get chart to display selected document instead of all documents
- Mark as New
- Bookmark
- Subscribe
- Mute
- Subscribe to RSS Feed
- Permalink
- Report Inappropriate Content
Found solution for most of my questions except controlling displayed text in Pop-up
For Legend, found some guidance here Formatting Bar Chart that will serve as a Legend for another Bar Chart