Unlock a world of possibilities! Login now and discover the exclusive benefits awaiting you.
- Qlik Community
- :
- All Forums
- :
- QlikView App Dev
- :
- Re: Help with chart design with total amounts
- Subscribe to RSS Feed
- Mark Topic as New
- Mark Topic as Read
- Float this Topic for Current User
- Bookmark
- Subscribe
- Mute
- Printer Friendly Page
- Mark as New
- Bookmark
- Subscribe
- Mute
- Subscribe to RSS Feed
- Permalink
- Report Inappropriate Content
Help with chart design with total amounts
Hi,
I am designing a bar chart with 2 dimenions - 'Month' and 'Year' and expression as
(if(match(TripType, 'NONBILLABLE' ,'nonbillable'),
sum({1}AirFareAmount)+sum({1}HotelBookedAmount)+sum({1}CarCostAmount))
)
when I do this,I get chart with 'No Data to display'
So I added the 'TripType' dimension to chart and now i get chart values but not the chart I was intended to -
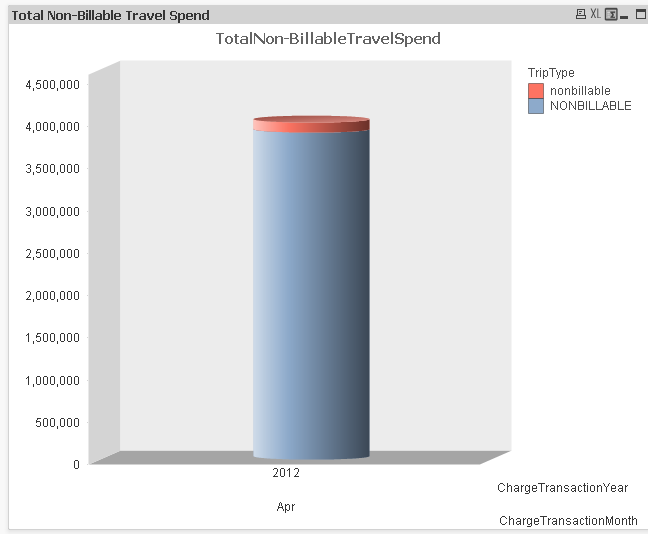
All I want to do is create a grouped chart by Months and Year and also chart is static no matter what other values in other list box (month or year) i select.
Can someone guide me on how to acheive this or if there is something wrong with my chart design.
Thanks
Kalyan
Accepted Solutions
- Mark as New
- Bookmark
- Subscribe
- Mute
- Subscribe to RSS Feed
- Permalink
- Report Inappropriate Content
- Mark as New
- Bookmark
- Subscribe
- Mute
- Subscribe to RSS Feed
- Permalink
- Report Inappropriate Content
Kalyan,
If statement is column level function not aggr function (ie., evaluates but not aggregates) hence you are not getting result unless TripType is added to dimensions.
{1} in set analysis indicates ignore all selections.
The expression you are looking for might be:
Sum({<TripType={'NONBILLABLE' ,'nonbillable'}>} AirFareAmount+HotelBookedAmount+CarCostAmount)
I think you have data only for Apr-2012 hence not able to see multiple bars (or selection is made).
Kiran.
- Mark as New
- Bookmark
- Subscribe
- Mute
- Subscribe to RSS Feed
- Permalink
- Report Inappropriate Content
Hi Kiran,
After using the expression you provided and still including TripType Dimension, It gives me "No data to display" in chart.
I tried removing TripType Dimension, but no luck.
Appreciate your suggestions. Any other?
Kalyan
- Mark as New
- Bookmark
- Subscribe
- Mute
- Subscribe to RSS Feed
- Permalink
- Report Inappropriate Content
Lets break one by one.
Create a text box with the below expression:
=Sum(AirFareAmount)+sum(HotelBookedAmount)+Sum(CarCostAmount)
Clear all selections and select 'NONBILLABLE' and 'nonbillable' in Triptype dimensions. We are trying to find it there is data at all for these triptype selections.
If this works add expression with previous set analysis into all these three sum functions, clear selections into the chart. If still doesnt work, there is some data issue and you may have to share your qvw.
Kiran.
- Mark as New
- Bookmark
- Subscribe
- Mute
- Subscribe to RSS Feed
- Permalink
- Report Inappropriate Content
Kiran,
I followed as per your instructions and did create a Text Box with Expression
=Sum(AirFareAmount)+sum(HotelBookedAmount)+Sum(CarCostAmount)
and I get Data without any filters.
Now i added Trip Type List Box and just selected 'NONBILLABLE' and 'nonbillable' only and see data for those selections too.
Now I added another TextBox with above Set analysis expression i get 0.
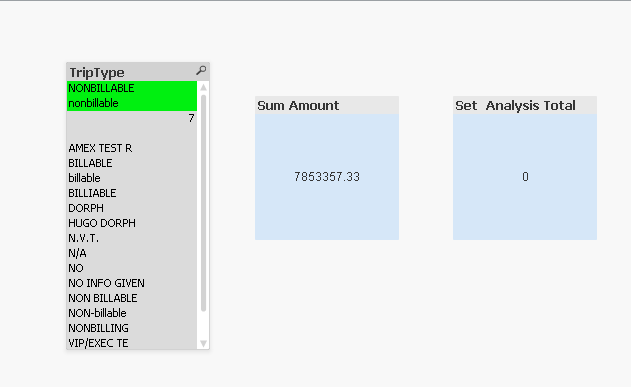
Attached is the QVW file.
- Mark as New
- Bookmark
- Subscribe
- Mute
- Subscribe to RSS Feed
- Permalink
- Report Inappropriate Content
Updated.
- Mark as New
- Bookmark
- Subscribe
- Mute
- Subscribe to RSS Feed
- Permalink
- Report Inappropriate Content
Thanks Kiran,
This now shows Amounts for 'NONBILLABLE' ,'nonbillable', but the Set Analysis seems to be not working, I want the chart to be static - to display all Years , months bars no matter what I select my Year and Month List boxes. Can this be acheived?
Kalyan
- Mark as New
- Bookmark
- Subscribe
- Mute
- Subscribe to RSS Feed
- Permalink
- Report Inappropriate Content
done.
Kiran.
- Mark as New
- Bookmark
- Subscribe
- Mute
- Subscribe to RSS Feed
- Permalink
- Report Inappropriate Content
Thanks Kiran, That works perfect. Although if I add any new List Boxes as filters, I guess i have add them to Set Analysis expression.
Kalyan