Unlock a world of possibilities! Login now and discover the exclusive benefits awaiting you.
- Qlik Community
- :
- All Forums
- :
- QlikView App Dev
- :
- Help with dates
- Subscribe to RSS Feed
- Mark Topic as New
- Mark Topic as Read
- Float this Topic for Current User
- Bookmark
- Subscribe
- Mute
- Printer Friendly Page
- Mark as New
- Bookmark
- Subscribe
- Mute
- Subscribe to RSS Feed
- Permalink
- Report Inappropriate Content
Help with dates
Good morning.
I'm working on a file where I have a chart with two expressions:
= Count ({$ <[Country] = {'Argentina'}>} DISTINCT [Case Number])
and
= Count ({$ <[Country] = {'Argentina'}, [state] = {'Solved'}>} DISTINCT [Case Number])
This graph compares the total registered cases vs total cases solved, the problem is when I selected a date for a control that has the expression = MonthName ([Date Close])because the first expression must be governed by a field called [Date created], and the second by [Date Close].
As I get when a date [Date Close] is selected, also the filter that date is executed, but for [date creation] and with this to see the difference in the open in the month vs the closeness in the month?
Thank you very much for your support.
- Tags:
- new_to_qlikview
Accepted Solutions
- Mark as New
- Bookmark
- Subscribe
- Mute
- Subscribe to RSS Feed
- Permalink
- Report Inappropriate Content
I think you will want to pull both dates together in a common date. For more info and examples, see:
Qlikview Cookbook: Tutorial - Using Common Date Dimensions http://qlikviewcookbook.com/recipes/download-info/tutorial-using-common-date-dimensions/
-Rob
- Mark as New
- Bookmark
- Subscribe
- Mute
- Subscribe to RSS Feed
- Permalink
- Report Inappropriate Content
Hi Jorge,
first of all, you should question yourself: Does the user really need to be able to select on this or that field?
Then, maybe it would be a possible solution to create more date_fields (combined from two different dates?) in the script and then make the expressions independent from this or that (you can make a set_expression disregard all user_selections, or just specific ones)
HTH
Best regards,
DataNibbler
- Mark as New
- Bookmark
- Subscribe
- Mute
- Subscribe to RSS Feed
- Permalink
- Report Inappropriate Content
Thank you very much for the prompt reply DataNibbler, I have prepared a model in which I show my need, I show below image:
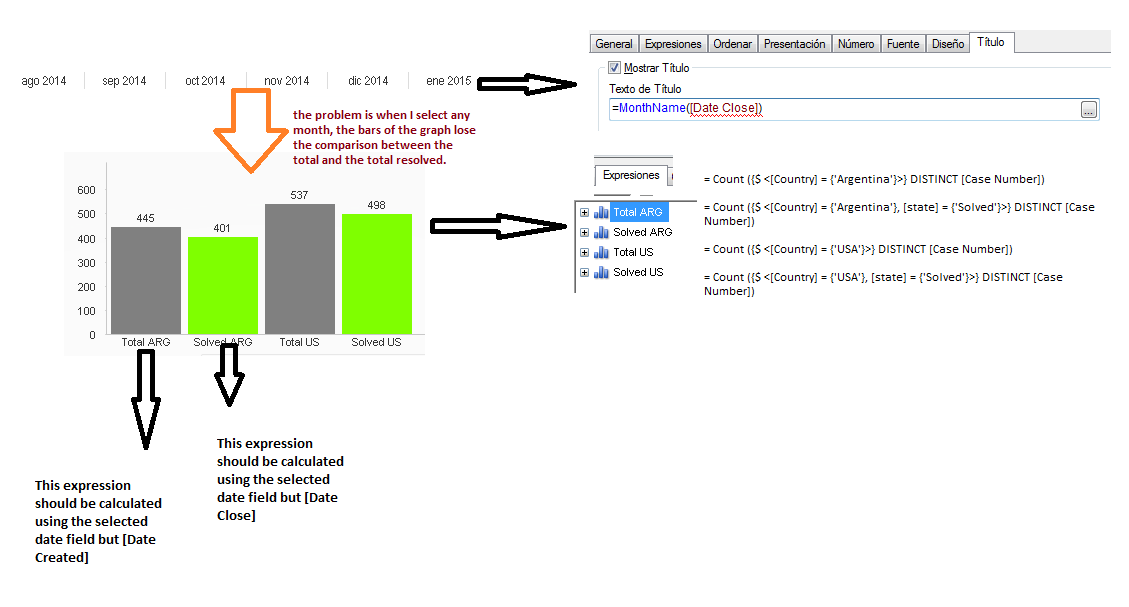
In the image I show a list of dates and a graph, the need is that the user can select a date and see the capacity of resolution in the month selected for each site.
I appreciate your support.
Best Regards.
- Mark as New
- Bookmark
- Subscribe
- Mute
- Subscribe to RSS Feed
- Permalink
- Report Inappropriate Content
Sorry DataNibbler, I was wrong to respond, re sending my answer :
Thank you very much for the prompt reply DataNibbler, I have prepared a model in which I show my need, I show below image:

In the image I show a list of dates and a graph, the need is that the user can select a date and see the capacity of resolution in the month selected for each site.
I appreciate your support.
Best Regards.
- Mark as New
- Bookmark
- Subscribe
- Mute
- Subscribe to RSS Feed
- Permalink
- Report Inappropriate Content
I don't quite understand what exactly is your issue here:
- I understand you have two date_fields:
- Date_Created
- Date_Closed
Those shouldn't interfere with each other actually, since a case can neither be closed nor solved before it has been created - so Date_Created is like your Start_Date - it should not rule out any cases (but those before)?
Anyway, you can use set_expressions I think to disregard any one selection_field you want in your expression: For instance
>> count({$<Date_Create = , Country = {"Argentina"}, status = {"closed"} DISTINCT case_nr>} <<
=> That will take into account all user_selections (because of the $), BUT the selection on >Date_Create< will be disregarded for this calculation.
HTH
Best regards,
DataNibbler
- Mark as New
- Bookmark
- Subscribe
- Mute
- Subscribe to RSS Feed
- Permalink
- Report Inappropriate Content
Sorry, I'm trying to test the expression on my chart, but I mark error can tell me where I'm wrong:
=count({$<[Date_Create]=, [Country] = {'Argentina'}, Estatus = {'Solved'} DISTINCT [Case_Nr]>}
Thanks for you help.
Regards.
- Mark as New
- Bookmark
- Subscribe
- Mute
- Subscribe to RSS Feed
- Permalink
- Report Inappropriate Content
I think you will want to pull both dates together in a common date. For more info and examples, see:
Qlikview Cookbook: Tutorial - Using Common Date Dimensions http://qlikviewcookbook.com/recipes/download-info/tutorial-using-common-date-dimensions/
-Rob
- Mark as New
- Bookmark
- Subscribe
- Mute
- Subscribe to RSS Feed
- Permalink
- Report Inappropriate Content
Thank you very much Rob, this is my case.
I implement shared solution.
Thank you very much for all your support.
Regards.