Unlock a world of possibilities! Login now and discover the exclusive benefits awaiting you.
- Qlik Community
- :
- All Forums
- :
- QlikView App Dev
- :
- Re: Hide Axis but Show grid in Radar Chart QlikVie...
- Subscribe to RSS Feed
- Mark Topic as New
- Mark Topic as Read
- Float this Topic for Current User
- Bookmark
- Subscribe
- Mute
- Printer Friendly Page
- Mark as New
- Bookmark
- Subscribe
- Mute
- Subscribe to RSS Feed
- Permalink
- Report Inappropriate Content
Hide Axis but Show grid in Radar Chart QlikView.
Hi,
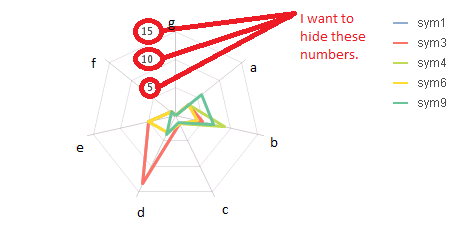
I created a radar chart in QlikView where i need to show grids but hide the values on axes. Checking both options doesn't work.
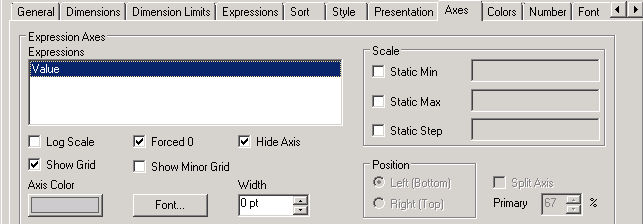
The grid hides as well. I want to achieve this.
Is it possible to achieve this?
Thanks.
- Mark as New
- Bookmark
- Subscribe
- Mute
- Subscribe to RSS Feed
- Permalink
- Report Inappropriate Content
Hi Shyamli,
On Dimensions, unselect show legend.
Regards!
- Mark as New
- Bookmark
- Subscribe
- Mute
- Subscribe to RSS Feed
- Permalink
- Report Inappropriate Content
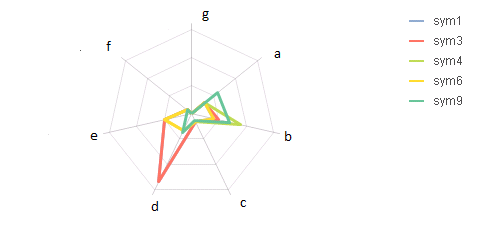
is this u want?
unchk in dimension tab show legend 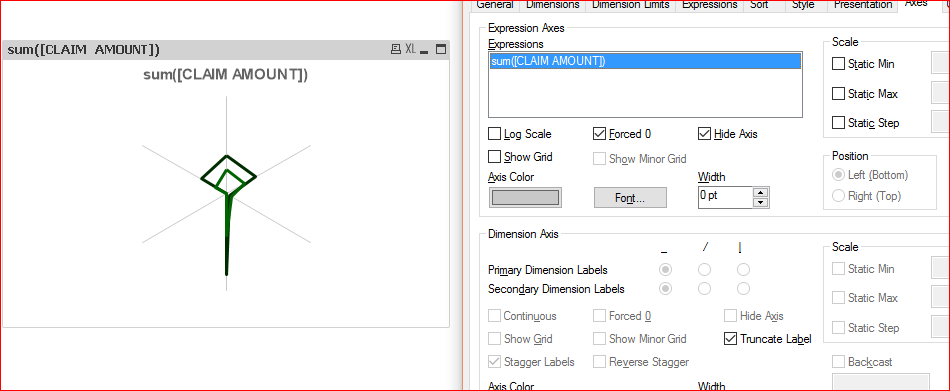
- Mark as New
- Bookmark
- Subscribe
- Mute
- Subscribe to RSS Feed
- Permalink
- Report Inappropriate Content
Hi
A simple workaround is set the Axes font color as white (or the same as chart background).
This will show the grid but hide the values.
- Mark as New
- Bookmark
- Subscribe
- Mute
- Subscribe to RSS Feed
- Permalink
- Report Inappropriate Content
Hi Manuel,
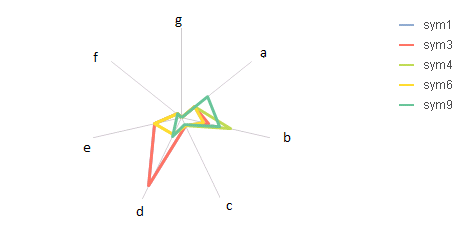
I want to show the legends.What I need to hide are the numbers on axis(see image), checking Hide axis in Axes tab does the trick but it hides the grids as well.
- Mark as New
- Bookmark
- Subscribe
- Mute
- Subscribe to RSS Feed
- Permalink
- Report Inappropriate Content
Hi Ankit,
Thanks, that is a good hack but changing the font color changes the colors of the labels a,b,c,d,e,f as well which is not desirable. Refer the image I put at Manuel's reply, that is exactly what I want to achieve.
- Mark as New
- Bookmark
- Subscribe
- Mute
- Subscribe to RSS Feed
- Permalink
- Report Inappropriate Content
Hi. I know this is a really old thread, but i was struggling with the same.
What you can do is click Hide Axis on the Axis tab, and then on the presentation tab add the appropriate reference lines.
It's a bit of a long way around, but that works for me