Unlock a world of possibilities! Login now and discover the exclusive benefits awaiting you.
- Qlik Community
- :
- All Forums
- :
- QlikView App Dev
- :
- Hide/show Pivot table dimension column depend on f...
- Subscribe to RSS Feed
- Mark Topic as New
- Mark Topic as Read
- Float this Topic for Current User
- Bookmark
- Subscribe
- Mute
- Printer Friendly Page
- Mark as New
- Bookmark
- Subscribe
- Mute
- Subscribe to RSS Feed
- Permalink
- Report Inappropriate Content
Hide/show Pivot table dimension column depend on filter which user selected
Hi,
I am new for QlikView, I want to Hide/Show Pivot table Dimension column depend on end user selection on other object.
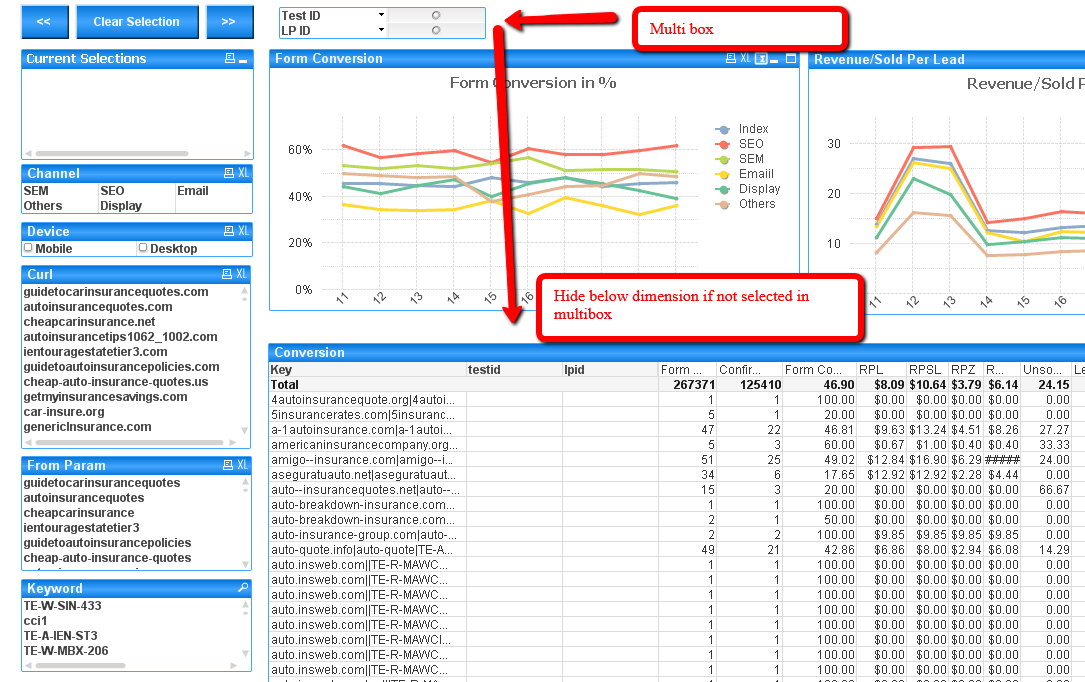
For example(Please refer attached image for reference)
If "testId" selected by user in MultiBox, Pivot table should have testid column otherwise no need to show column "testID" in pivot table.
Same thing for Device and Channel.
Accepted Solutions
- Mark as New
- Bookmark
- Subscribe
- Mute
- Subscribe to RSS Feed
- Permalink
- Report Inappropriate Content
if you want to show/hide columns in a chart depending on number of values selected in a field
have a look in the online help at
getselectedcount (FieldName [, IncludeExcluded])
Returns the current number of selected values in a field.
or similar functions (getpossiblecount)
and also here
to show/hide columns
- Mark as New
- Bookmark
- Subscribe
- Mute
- Subscribe to RSS Feed
- Permalink
- Report Inappropriate Content
Thank you very much. This help me to solve this issue.
I added this function on Dimension "Enable Condition" box to show only if it is selected>0.
Appreciate your help.