Unlock a world of possibilities! Login now and discover the exclusive benefits awaiting you.
- Qlik Community
- :
- All Forums
- :
- QlikView App Dev
- :
- Hide unneeded rows in qlik view 11
- Subscribe to RSS Feed
- Mark Topic as New
- Mark Topic as Read
- Float this Topic for Current User
- Bookmark
- Subscribe
- Mute
- Printer Friendly Page
- Mark as New
- Bookmark
- Subscribe
- Mute
- Subscribe to RSS Feed
- Permalink
- Report Inappropriate Content
Hide unneeded rows in qlik view 11
Hello,
I tried here to calculate the forecast accuracy of products expressing in percentage. My aim is to deal with the products that have a bad accuracy ( less than 80%) so i want to let in my chart only the product that they have a bad accuracy and do hide finally products with accuracy upper than 80%.
How can I do, please?
Best regards,
Alâa Eddine.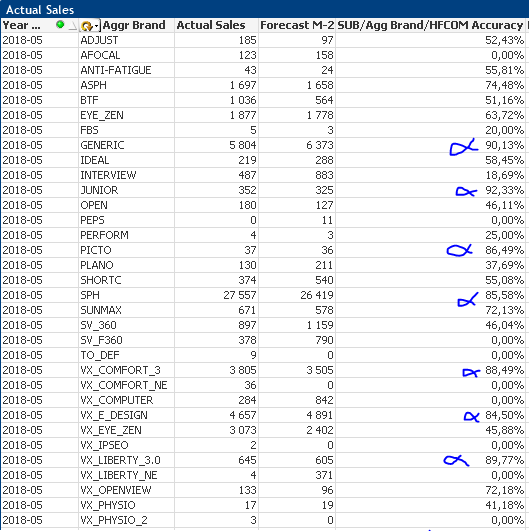
- « Previous Replies
- Next Replies »
- Mark as New
- Bookmark
- Subscribe
- Mute
- Subscribe to RSS Feed
- Permalink
- Report Inappropriate Content
Sure, no problem. In this case will it be possible for you to share your sample application ?
You can attach the sample by clicking "Use Advanced editor"
Br,
KC
KC
- Mark as New
- Bookmark
- Subscribe
- Mute
- Subscribe to RSS Feed
- Permalink
- Report Inappropriate Content
Hello KC,
i do not know how to do this. Is there any other idea, please?
Thank you,
Alâa Eddine.
- Mark as New
- Bookmark
- Subscribe
- Mute
- Subscribe to RSS Feed
- Permalink
- Report Inappropriate Content
Try this:
replace your SalesYearMonth dimension with below . You have to then modify your cyclic field as well using the same logic, just replace SalesYearMonth with other fields.
=aggr(If(
If ((1- (sum (fabs(aggr(sum ([SalesActualSales])
, SalesSubsidiaryCode_CD, SalesAggregatedBrand_CD,SalesYearMonth) -
aggr(sum ([SalesForecastM-2]), SalesSubsidiaryCode_CD, SalesAggregatedBrand_CD,SalesYearMonth)))/sum(aggr(sum([SalesActualSales]),
SalesSubsidiaryCode_CD, SalesAggregatedBrand_CD,SalesYearMonth ))) < 0
or sum(aggr(sum([SalesActualSales]), SalesSubsidiaryCode_CD, SalesAggregatedBrand_CD
,SalesYearMonth))= 0),0
,1- (sum (fabs(aggr(sum ([SalesActualSales]), SalesSubsidiaryCode_CD,
SalesAggregatedBrand_CD,SalesYearMonth)
- aggr(sum ([SalesForecastM-2]), SalesSubsidiaryCode_CD, SalesAggregatedBrand_CD,
SalesYearMonth)))
/sum(aggr(sum([SalesActualSales]), SalesSubsidiaryCode_CD,
SalesAggregatedBrand_CD,SalesYearMonth ))))
> '0.8',null(),SalesYearMonth),SalesYearMonth)
KC
- « Previous Replies
- Next Replies »