Unlock a world of possibilities! Login now and discover the exclusive benefits awaiting you.
- Qlik Community
- :
- All Forums
- :
- QlikView App Dev
- :
- Hide unneeded rows in qlik view 11
- Subscribe to RSS Feed
- Mark Topic as New
- Mark Topic as Read
- Float this Topic for Current User
- Bookmark
- Subscribe
- Mute
- Printer Friendly Page
- Mark as New
- Bookmark
- Subscribe
- Mute
- Subscribe to RSS Feed
- Permalink
- Report Inappropriate Content
Hide unneeded rows in qlik view 11
Hello,
I tried here to calculate the forecast accuracy of products expressing in percentage. My aim is to deal with the products that have a bad accuracy ( less than 80%) so i want to let in my chart only the product that they have a bad accuracy and do hide finally products with accuracy upper than 80%.
How can I do, please?
Best regards,
Alâa Eddine.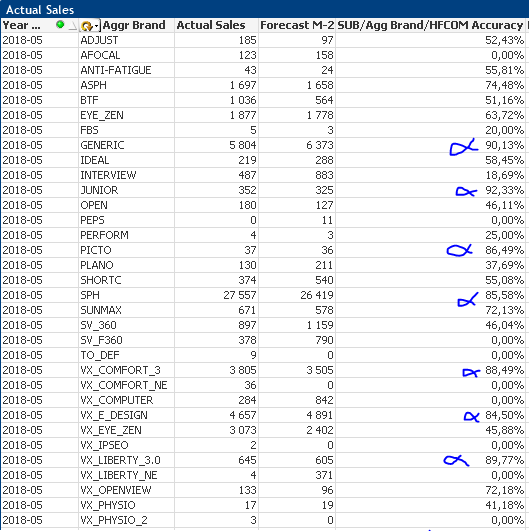
- Mark as New
- Bookmark
- Subscribe
- Mute
- Subscribe to RSS Feed
- Permalink
- Report Inappropriate Content
so just click on the attachement, it will download automatically. double click on it on windows, it will open automatically on your qlikview desktop
- Mark as New
- Bookmark
- Subscribe
- Mute
- Subscribe to RSS Feed
- Permalink
- Report Inappropriate Content
Hello,
this is what i did but it did not work.
I solve a part of my problem so i send you if you do not mind what i did not understand it.
I want now to hide these rows that contain empty cells in accuracy column.

Thank you.
- Mark as New
- Bookmark
- Subscribe
- Mute
- Subscribe to RSS Feed
- Permalink
- Report Inappropriate Content
ok, just give me your accuracy expression that you're using now
- Mark as New
- Bookmark
- Subscribe
- Mute
- Subscribe to RSS Feed
- Permalink
- Report Inappropriate Content
Hello,
thi is the formula:
If ((1- (sum (fabs(aggr(sum ([SalesActualSales])
, SalesSubsidiaryCode_CD, SalesAggregatedBrand_CD,SalesYearMonth) -
aggr(sum ([SalesForecastM-2]), SalesSubsidiaryCode_CD, SalesAggregatedBrand_CD,SalesYearMonth)))/sum(aggr(sum([SalesActualSales]),
SalesSubsidiaryCode_CD, SalesAggregatedBrand_CD,SalesYearMonth ))) < 0
or sum(aggr(sum([SalesActualSales]), SalesSubsidiaryCode_CD, SalesAggregatedBrand_CD
,SalesYearMonth))= 0),null()
,If(1- (sum (fabs(aggr(sum ([SalesActualSales])
, SalesSubsidiaryCode_CD, SalesAggregatedBrand_CD,SalesYearMonth) -
aggr(sum ([SalesForecastM-2]), SalesSubsidiaryCode_CD, SalesAggregatedBrand_CD,SalesYearMonth)))/sum(aggr(sum([SalesActualSales]),
SalesSubsidiaryCode_CD, SalesAggregatedBrand_CD,SalesYearMonth )))<0.8,1- (sum (fabs(aggr(sum ([SalesActualSales]), SalesSubsidiaryCode_CD,
SalesAggregatedBrand_CD,SalesYearMonth)- aggr(sum ([SalesForecastM-2]), SalesSubsidiaryCode_CD, SalesAggregatedBrand_CD,SalesYearMonth)))
/sum(aggr(sum([SalesActualSales]), SalesSubsidiaryCode_CD,
SalesAggregatedBrand_CD,SalesYearMonth ))),null()))
Thanks a lot.
- Mark as New
- Bookmark
- Subscribe
- Mute
- Subscribe to RSS Feed
- Permalink
- Report Inappropriate Content
Hi Alaa,
Since you have two dimensions, also one among them is a cyclic filed i have modified the sample a bit.
Hope this will help you. You just have to replace the "num(sum(Sale)/Sum(Target)" part with your expression.
Br,
KC
KC
- Mark as New
- Bookmark
- Subscribe
- Mute
- Subscribe to RSS Feed
- Permalink
- Report Inappropriate Content
Hello KC,
I do not know where you found this expression: "num(sum(Sale)/Sum(Target)". If it is in your attachment i cannot open it, so please copy and paste the formula that you are talking about in a message to understand you.
Thank you,
Alâa Eddine.
- Mark as New
- Bookmark
- Subscribe
- Mute
- Subscribe to RSS Feed
- Permalink
- Report Inappropriate Content
Hello KC,
can you modify my expression so that i can hide the unneeded rows, please?
Thank you,
Alâa Eddine.
- Mark as New
- Bookmark
- Subscribe
- Mute
- Subscribe to RSS Feed
- Permalink
- Report Inappropriate Content
Can you share your dimension names ? The fields under cyclic group.
Br,
KC
KC
- Mark as New
- Bookmark
- Subscribe
- Mute
- Subscribe to RSS Feed
- Permalink
- Report Inappropriate Content
Try like this:
Create a variable vVar1 and set your expression under it without "=" sign.
Then modify your dimensions like this:
=aggr(if($(vVar1)>='0.8',null(),YearMon),YearMon)
Br,
KC
KC
- Mark as New
- Bookmark
- Subscribe
- Mute
- Subscribe to RSS Feed
- Permalink
- Report Inappropriate Content
Hello KC,
thank you but i am beginner in Qlik View and i do not know how to create variables. This is a figure that contains my dimensions names.
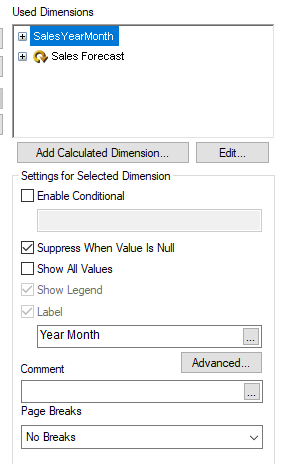 Thank you.
Alâa Eddine