Unlock a world of possibilities! Login now and discover the exclusive benefits awaiting you.
- Qlik Community
- :
- All Forums
- :
- QlikView App Dev
- :
- Re: Highlight Chart Axis Label - Help
- Subscribe to RSS Feed
- Mark Topic as New
- Mark Topic as Read
- Float this Topic for Current User
- Bookmark
- Subscribe
- Mute
- Printer Friendly Page
- Mark as New
- Bookmark
- Subscribe
- Mute
- Subscribe to RSS Feed
- Permalink
- Report Inappropriate Content
Highlight Chart Axis Label - Help
Hi,
I have the following line Chart :
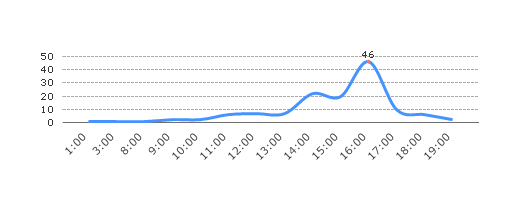
Is it possible to highlight the x-axis label that has the highest value? In this case I would like to change 16:00 to a different colour...
Any help or alternative solution is very much appreciated.
Tom
- Tags:
- chart_axis_labels
- Mark as New
- Bookmark
- Subscribe
- Mute
- Subscribe to RSS Feed
- Permalink
- Report Inappropriate Content
You could create another expression, set its Display Options to Text on Axis and give it a Text Format expression to change the colour as needed with a suitable expression.
Don't forget to untick Label for the Dimension.
- Mark as New
- Bookmark
- Subscribe
- Mute
- Subscribe to RSS Feed
- Permalink
- Report Inappropriate Content
Hi.
There is no way to change the color of labels directly.
But you can try to hide the built-in chart labels and add another transparent chart straight table object at the bottom.
Using background color expression you should be able to colorize text appropriately.
To hide the cell boarders try to use advanced styling mode.
Hope this helps.
- Mark as New
- Bookmark
- Subscribe
- Mute
- Subscribe to RSS Feed
- Permalink
- Report Inappropriate Content
Hi Tom,
why don't you look at this video which explains the technique to highlight the dimension in a chart in detail:
QlikView : Highlighting specific dimension label on bar chart - YouTube
Happy Qliking
Burkhard