Unlock a world of possibilities! Login now and discover the exclusive benefits awaiting you.
- Qlik Community
- :
- All Forums
- :
- QlikView App Dev
- :
- Highlighting a entire row for max/min column condi...
- Subscribe to RSS Feed
- Mark Topic as New
- Mark Topic as Read
- Float this Topic for Current User
- Bookmark
- Subscribe
- Mute
- Printer Friendly Page
- Mark as New
- Bookmark
- Subscribe
- Mute
- Subscribe to RSS Feed
- Permalink
- Report Inappropriate Content
Highlighting a entire row for max/min column condition in a table
Hi,
I wish to highlight the entire row ( or few columns of my choice) with different background in the attach qvw when a max. or min value in the table. In my case I am checking for max. business performance across all the regions and highlighting that region. Visual cues seems to handle only the selected column on which the max. and min. condition is set.
The rows should get highlighted only when the records displayed are more than 2. It should not highlight the total shown at the bottom.
Please assist.
Thanks
Laxmikant
Accepted Solutions
- Mark as New
- Bookmark
- Subscribe
- Mute
- Subscribe to RSS Feed
- Permalink
- Report Inappropriate Content
- Mark as New
- Bookmark
- Subscribe
- Mute
- Subscribe to RSS Feed
- Permalink
- Report Inappropriate Content
Hi,
Please find attached file. Is this how you want it?
Regards
Arun
- Mark as New
- Bookmark
- Subscribe
- Mute
- Subscribe to RSS Feed
- Permalink
- Report Inappropriate Content
Thanks Arun for the solution. But it works with sample/test data. With the actual data in my application I am not able to get this work. the if condition does return false always.
Please find the attach screen shot.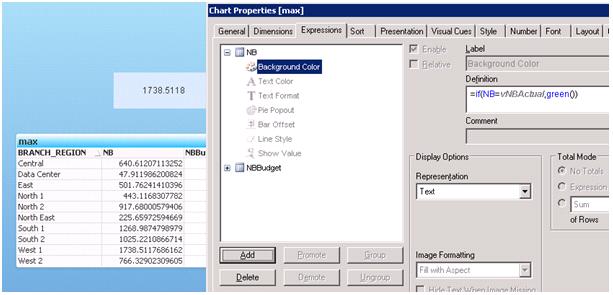
- Mark as New
- Bookmark
- Subscribe
- Mute
- Subscribe to RSS Feed
- Permalink
- Report Inappropriate Content
Can u upload the doc for me to take a look at it.
Arun
- Mark as New
- Bookmark
- Subscribe
- Mute
- Subscribe to RSS Feed
- Permalink
- Report Inappropriate Content
After further analysis its now working. The thing that has to be taken care is rounding off the data explicitly while comparing.
For eg. the data for that column is made as an integer data type and displayed in % using the object properties Number tab. So on screen for eg. the number that display -17% actually is holding the value -16.6696454 where as the variable has calculated the value to -16.669645391231. so comparision failed.
- Mark as New
- Bookmark
- Subscribe
- Mute
- Subscribe to RSS Feed
- Permalink
- Report Inappropriate Content
Ok gr8. Pls mark the discussion as answered.
Thanks
Arun
- Mark as New
- Bookmark
- Subscribe
- Mute
- Subscribe to RSS Feed
- Permalink
- Report Inappropriate Content
One more thing ...you can add one more piece of code so that the row gets highlighted only when more than two rows are selected:
if
(Performance=var_performance and GetPossibleCount(Region)>2,green())
See test3 file attached