Unlock a world of possibilities! Login now and discover the exclusive benefits awaiting you.
- Qlik Community
- :
- All Forums
- :
- QlikView App Dev
- :
- Re: Hints on how to solve entry/exit problem
- Subscribe to RSS Feed
- Mark Topic as New
- Mark Topic as Read
- Float this Topic for Current User
- Bookmark
- Subscribe
- Mute
- Printer Friendly Page
- Mark as New
- Bookmark
- Subscribe
- Mute
- Subscribe to RSS Feed
- Permalink
- Report Inappropriate Content
Hints on how to solve entry/exit problem
I want to built two charts :
1) a bar chart showing the evolution over time of "incident tickets" entries and "incident tickets" exits
2) a bar chart showing the evolution over time of the amount of unsolved "incident tickets" (unsolved meaning "entry date" <= date and "exit date" > date
Of course "incident tickets" have many attributes and I want to be able to filter on those.
Let's assume my entry data looks like this (I could have one file per day for instance, in which case my data would have an additional column for the exportdate)
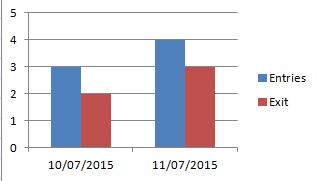
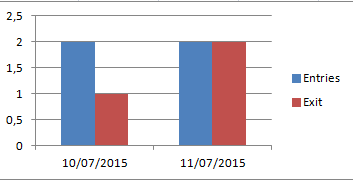
| Entry Date | Exit Date | Type | |
| 1 | 10/07/2015 | 10/07/2015 | Bug |
| 2 | 10/07/2015 | 10/07/2015 | Info |
| 3 | 10/07/2015 | 11/07/2015 | Bug |
| 4 | 11/07/2015 | Info | |
| 5 | 11/07/2015 | 11/07/2015 | Bug |
| 6 | 11/07/2015 | 11/07/2015 | Info |
| 7 | 11/07/2015 | Bug |
I want to have this for evolution over time for entries/exits
this for evolution over time for entries/exits for type bug
this for evolution of amount of unsolved

I tried many directions but always get blocked either by losing filtering capability, or ending up with a somehow messy data model.
Any hint would be greatly appreciated.
Accepted Solutions
- Mark as New
- Bookmark
- Subscribe
- Mute
- Subscribe to RSS Feed
- Permalink
- Report Inappropriate Content
I order to 'explode' the date I would
1. Load the full data set
LOAD Entrydate AS Date, Type, 'Entry' AS RecordType
2. Load only Exits
CONCATENATE LOAD Exitdate AS Date, Type, 'Exit' AS RecordType
WHERE Exitdate is not null()
Now you have a common Date dimension, and you can use the new RecordType in the set analysis
e.g. Count ({$<RecordType = {'Exit'} >} Type) to count exits on the Date dimension
- Mark as New
- Bookmark
- Subscribe
- Mute
- Subscribe to RSS Feed
- Permalink
- Report Inappropriate Content
In order to make chart 1), I would explode the data, so you get 1 record for the entry and 1 record for the eventual exit. The records can then share a date dimension, which you can use for the chart.
Chart 2): Does that count the accumulative number of open incidents? Or is the incident only counted on the date of the entry?
- Mark as New
- Bookmark
- Subscribe
- Mute
- Subscribe to RSS Feed
- Permalink
- Report Inappropriate Content
For 1) how do you "explode" the data?
I went that way by loading the data twice:
-first the full table (qualified) leaving the "Entry date" as the shared dimension.
-second just a smaller table with the id and the Exit date as the shared dimension.
It works but I cannot filter anymore by type for the exits
I then loaded the full table twice with the shared date dimension being once fhe entry date and the other time the exit date, but by doing that the data model looks messy as the shared column is now a big aggregated of all fields...
For 2) yes it is the cumulative amount
- Mark as New
- Bookmark
- Subscribe
- Mute
- Subscribe to RSS Feed
- Permalink
- Report Inappropriate Content
I think I would start with
SET DateFormat = 'DD/MM/YYYY';


INCIDENTS:
LOAD ID, [Entry Date], [Exit Date], Type, if(len(trim([Exit Date]))=0, today(), [Exit Date]) as [Exit2] INLINE [
ID, Entry Date, Exit Date, Type
1, 10/07/2015, 10/07/2015, Bug
2, 10/07/2015, 10/07/2015, Info
3, 10/07/2015, 11/07/2015, Bug
4, 11/07/2015, ,Info
5, 11/07/2015, 11/07/2015, Bug
6, 11/07/2015, 11/07/2015, Info
7, 11/07/2015, ,Bug

];


LOAD ID, Date([Entry Date]+ iterno()-1) as UnresolvedDate
RESIDENT INCIDENTS
WHILE [Entry Date]+ iterno()-1 < [Exit2];


CrossTable (DateType, Date, 2 )
LOAD ID, Type, [Entry Date], [Exit Date]
RESIDENT INCIDENTS;

Drop table INCIDENTS;
This will create two tables linked by ID (one can also think about force-concatenating these two tables and having one common Date field).
The first two charts can be build by using Date and DateType as dimensions and
=Count(DISTINCT ID)
resp.
=Count({<Type = {Bug}>} DISTIINCT ID)
as expression.
The last chart can be created using UnresolvedDate as dimension, and
=Count(ID)
as expression.
Hope this helps,
Stefan
edit:
Attached a sample
- Mark as New
- Bookmark
- Subscribe
- Mute
- Subscribe to RSS Feed
- Permalink
- Report Inappropriate Content
I order to 'explode' the date I would
1. Load the full data set
LOAD Entrydate AS Date, Type, 'Entry' AS RecordType
2. Load only Exits
CONCATENATE LOAD Exitdate AS Date, Type, 'Exit' AS RecordType
WHERE Exitdate is not null()
Now you have a common Date dimension, and you can use the new RecordType in the set analysis
e.g. Count ({$<RecordType = {'Exit'} >} Type) to count exits on the Date dimension
- Mark as New
- Bookmark
- Subscribe
- Mute
- Subscribe to RSS Feed
- Permalink
- Report Inappropriate Content
Ok this works and is crystal clear!
- Mark as New
- Bookmark
- Subscribe
- Mute
- Subscribe to RSS Feed
- Permalink
- Report Inappropriate Content
I went for Jens Frederik's solution as it was closer to my existing code. But I will try this one too as it uses a different approach and elements I have never used.
- Mark as New
- Bookmark
- Subscribe
- Mute
- Subscribe to RSS Feed
- Permalink
- Report Inappropriate Content
No problem, loading the data twice, once for Entry and once for Exit record set, creating a common Date field is doing the same as the CROSSTABLE LOAD (lines 23 to 25) in my sample.
How have you created the evolution of unsolved with that solution?