Unlock a world of possibilities! Login now and discover the exclusive benefits awaiting you.
- Qlik Community
- :
- All Forums
- :
- QlikView App Dev
- :
- Re: How Do I make the line Chart display multiple ...
- Subscribe to RSS Feed
- Mark Topic as New
- Mark Topic as Read
- Float this Topic for Current User
- Bookmark
- Subscribe
- Mute
- Printer Friendly Page
- Mark as New
- Bookmark
- Subscribe
- Mute
- Subscribe to RSS Feed
- Permalink
- Report Inappropriate Content
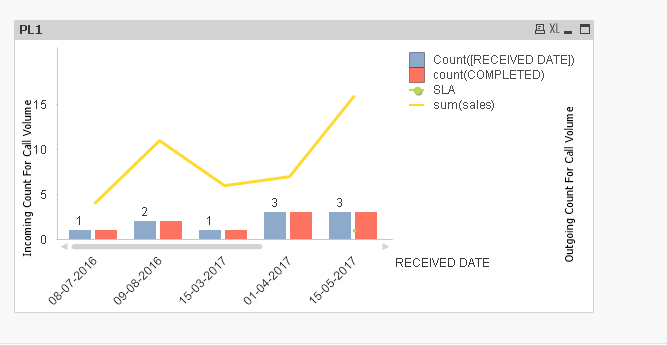
How Do I make the line Chart display multiple lines for a dataset
I need a line chart that has a line for several data sets like the attached pic.
Any help would be appreciated.
- Mark as New
- Bookmark
- Subscribe
- Mute
- Subscribe to RSS Feed
- Permalink
- Report Inappropriate Content
Create a combo chart with month as dimension and create each expression for a line and for the summary check the option as bar
- Mark as New
- Bookmark
- Subscribe
- Mute
- Subscribe to RSS Feed
- Permalink
- Report Inappropriate Content
Hi Tim Jones,
Go to new Sheet Object>Charts>Line Chart>
Dimension>MMM-YYYY
Expressions> Add Button> U can write a Expression in fields like that
Expressions> Add Button> U can write a Expression in fields like that
Expressions> Add Button> U can write a Expression in fields like that ...
Like this you can add required expressions
Display Options select what ever line type required
- Mark as New
- Bookmark
- Subscribe
- Mute
- Subscribe to RSS Feed
- Permalink
- Report Inappropriate Content
Can you show me an example ?
- Mark as New
- Bookmark
- Subscribe
- Mute
- Subscribe to RSS Feed
- Permalink
- Report Inappropriate Content
Can you show me a real example ?
- Mark as New
- Bookmark
- Subscribe
- Mute
- Subscribe to RSS Feed
- Permalink
- Report Inappropriate Content
Hi plz check above sample diagram like that how many lines required u can write that many expressions
note: display options take option Line