Unlock a world of possibilities! Login now and discover the exclusive benefits awaiting you.
- Qlik Community
- :
- All Forums
- :
- QlikView App Dev
- :
- How I can make 2 group by? (¿Cómo puedo hacer 2 gr...
- Subscribe to RSS Feed
- Mark Topic as New
- Mark Topic as Read
- Float this Topic for Current User
- Bookmark
- Subscribe
- Mute
- Printer Friendly Page
- Mark as New
- Bookmark
- Subscribe
- Mute
- Subscribe to RSS Feed
- Permalink
- Report Inappropriate Content
How I can make 2 group by? (¿Cómo puedo hacer 2 group by?)
Hello everyone,
I'm new in QlikView, I read the tutorial this there are the web but is too basic in my opinion, and I find sources which explain more things about queries and selections, as well as terms and nomenclature used QlikView . So I ask this question to see if anyone can help.
I have two .csv files (tabal1.csv and tabla2.csv) and that's where will upload the tables, let 'Table1' and 'Table 2'. These tables have many columns each, but I will give an example of what I do. Suppose we are interested in each table the following columns connected by the 'ID' column:
Table 1:
ID Tech Site
1 4G if
2 3G if
3 3G not
4 2G not
5 2G if
Table 2:
ID Vo1 Vo2
1 10 0
2 0 67
March 3 34
4 4 0
5 0 0
Note: You can not have a row with 4G and Site Tech = = 'no', provided that Tech is 4G, Site will be 'yes'.
What I get is: Sum (Vo1 + Vo2) and grouped by Site Tech (which is not the best order), but only Tech group 2G and 3G, 4G no. Therefore, the result table should look like:
Agrupacion Total (Sum (Vo1 + Vo2))
4G (if) 10
3G-2G (if) 67
3G-2G (no) 41
No I have come to explain properly, anything you can ask me. The main problem is I do not know the nomenclature (syntax) using QlikView, so do not even know how to start loading only those columns that interest me, and not load the entire tables ...
Thank you very much in advance and I hope your answers !!
Greetings to all !!!!
Translated with Google Translate - Qlik Community Administrative Team
Hola a todos, soy nuevo en QlikView, me leí el tutorial este que hay por la web pero es demasiado básico en mi opinión, y no encuentro fuentes donde expliquen más cosas acerca de consultas y selecciones, así como expresiones y la nomenclatura que utiliza QlikView. Por eso hago esta pregunta a ver si alguien puede ayudarme.
Yo tengo dos archivos .csv (tabal1.csv y tabla2.csv) y de ahí es de donde cargaré las tablas, supongamos 'Tabla1' y 'Tabla 2'. Estas tablas tienen muchas columnas cada una, pero voy a poner un ejemplo de lo que quiero hacer. Supongamos que de cada tabla nos interesan las siguientes columnas, conectadas por la columna 'ID':
Tabla1:
ID Tech Site
1 4G si
2 3G si
3 3G no
4 2G no
5 2G si
Tabla2:
ID Vo1 Vo2
1 10 0
2 0 67
3 3 34
4 4 0
5 0 0
Nota: no puede haber una fila con Tech=4G y Site='no', siempre que Tech sea 4G, Site será 'sí'.
Lo que quiero obtener es: Sum(Vo1+Vo2) agrupado por Site y Tech (no se cual es el mejor orden), pero en Tech agrupar solo el 2G y el 3G, el 4G no. Por tanto, la tabla resultado debería quedar así:
Agrupacion Total (Sum(Vo1+Vo2))
4G (si) 10
3G-2G (si) 67
3G-2G (no) 41
No se si he llegado a explicarme correctamente, cualquier cosa me podéis preguntar. El principal problema es que no conozco la nomenclatura (sintaxis) que utiliza QlikView, por eso no sé ni cómo empezar a cargar solo esas columnas que me interesan, y no cargar las tablas enteras... 
Muchas gracias de antemano y espero vuestras respuestas!!
Un saludo a todos!!!!
- « Previous Replies
-
- 1
- 2
- Next Replies »
Accepted Solutions
- Mark as New
- Bookmark
- Subscribe
- Mute
- Subscribe to RSS Feed
- Permalink
- Report Inappropriate Content
Hi ,
Please use below expression
=
if(Match(Tech, '2G','3G') and Match(Site, 'no'), '3G-2G no-site 4G',
If(Match(Tech, '2G','3G') and Match(Site, 'si'), '3G-2G cosite 4G', If(Match(Tech, '4G'), '4G')))
Regards,
Perumal A
- Mark as New
- Bookmark
- Subscribe
- Mute
- Subscribe to RSS Feed
- Permalink
- Report Inappropriate Content
tienes que hacer un left join entre ambas tablas y luego puedes hacer la suma
- Mark as New
- Bookmark
- Subscribe
- Mute
- Subscribe to RSS Feed
- Permalink
- Report Inappropriate Content
you can use a calculated dimension (yellow)
=if(Match(Tech, '2G','3G'), '3G-2G', Tech)
- Mark as New
- Bookmark
- Subscribe
- Mute
- Subscribe to RSS Feed
- Permalink
- Report Inappropriate Content
I'm using QV Personal Edition, and I am not able to use the .qvw yo gave me. So please, can you paste the code?
Thank you very much!
EDIT: At least, I have done it with this calculated dimension:
=if(Match(Tech, '2G','3G') and Match(Site, 'no'), '3G-2G no-site 4G', If(Match(Tech, '2G','3G') and Match(Site, 'sí'), '3G-2G cosite 4G', If(Match(Tech, '4G'), '4G')))
Thank you!
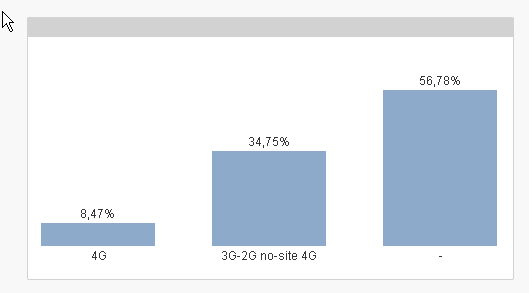
I have a question now: I am doing a bar graph, and I am printing it stacked, so, I have onle one bar, with three divisions, and the question is: how can I show the percentage of each division? Because I am only able to show the percentage of 100% a the top of the bar...
- Mark as New
- Bookmark
- Subscribe
- Mute
- Subscribe to RSS Feed
- Permalink
- Report Inappropriate Content
La suma sí que sé hacerla, pero lo que no sé es cómo sumar los de 2G y 3G con Site=sí, y los de 2G y 3G con site=no
Muchas gracias por responder
- Mark as New
- Bookmark
- Subscribe
- Mute
- Subscribe to RSS Feed
- Permalink
- Report Inappropriate Content
there wasn't any interesting code in the load script only 2 inline tables for your data
Tabla1:
load * inline [
ID, Tech , Site
1 ,4G,si
2 ,3G,si
3 ,3G,no
4 ,2G,no
5 ,2G,si
];
Tabla2:
load * inline [
ID, Vo1, Vo2
1, 10, 0
2, 0, 67
3, 3, 34
4, 4, 0
5, 0, 0
];
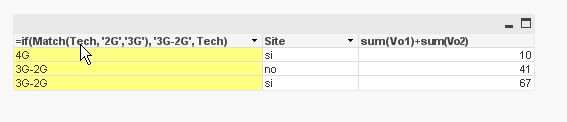
the chart is a straight table with 2 dimensions and one expression; the code for dims and expr is what you see on the label
dim1 if(Match(Tech, '2G','3G'), '3G-2G', Tech)
dim2 Site
expr sum(Vo1)+sum(Vo2)
why not a grouped bar chart? simple and easy to understand for users
- Mark as New
- Bookmark
- Subscribe
- Mute
- Subscribe to RSS Feed
- Permalink
- Report Inappropriate Content
Hi ,
Please use below expression
=
if(Match(Tech, '2G','3G') and Match(Site, 'no'), '3G-2G no-site 4G',
If(Match(Tech, '2G','3G') and Match(Site, 'si'), '3G-2G cosite 4G', If(Match(Tech, '4G'), '4G')))
Regards,
Perumal A
- Mark as New
- Bookmark
- Subscribe
- Mute
- Subscribe to RSS Feed
- Permalink
- Report Inappropriate Content
despues del join puedes concatenar los campos agrupados por site y luego hacer otro join donde hagas la suma agrupado por el resultado de esa concatenación
- Mark as New
- Bookmark
- Subscribe
- Mute
- Subscribe to RSS Feed
- Permalink
- Report Inappropriate Content
I know that it is easier to understand if not stacked, but we want to compare these three divisions among months..., so Month is now another dimension.
The field 'Fecha' contains the dates in this format: 20150401, 20150402,...,20150430 (yyyymmdd). If I am interested only in April, how can I do this selection?
Thank you very much!
- Mark as New
- Bookmark
- Subscribe
- Mute
- Subscribe to RSS Feed
- Permalink
- Report Inappropriate Content
It definitely works fine!
Another question:
We want to compare these three divisions among months..., so Month is now another dimension.
The field 'Fecha' contains the dates in this format: 20150401, 20150402,...,20150430 (yyyymmdd). If I am interested only in April, how can I do this selection? How can I modify the expression you gave me to select only the rows that field 'Fecha'='April'?
Thank you very much!
- « Previous Replies
-
- 1
- 2
- Next Replies »