Unlock a world of possibilities! Login now and discover the exclusive benefits awaiting you.
- Qlik Community
- :
- All Forums
- :
- QlikView App Dev
- :
- Re: How can I change Y axis to always maximum 100%...
- Subscribe to RSS Feed
- Mark Topic as New
- Mark Topic as Read
- Float this Topic for Current User
- Bookmark
- Subscribe
- Mute
- Printer Friendly Page
- Mark as New
- Bookmark
- Subscribe
- Mute
- Subscribe to RSS Feed
- Permalink
- Report Inappropriate Content
How can I change Y axis to always maximum 100% view
Hi Everyone,
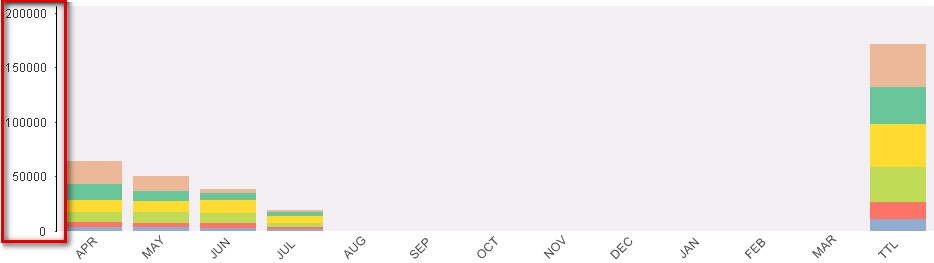
Can somebody help me I want to change the Y-Axis to 100% max instead of the actual value.
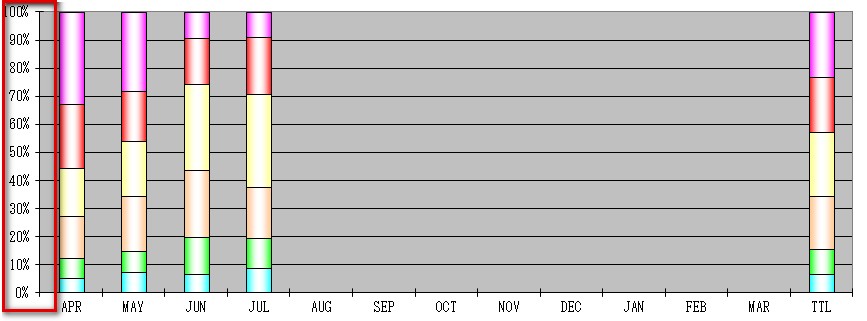
Please see attached file. I would like to look like the YAxis 100% View a.jpg.
Thanks.
- Tags:
- new_to_qlikview
Accepted Solutions
- Mark as New
- Bookmark
- Subscribe
- Mute
- Subscribe to RSS Feed
- Permalink
- Report Inappropriate Content
Hi,
Please find attached file for solution.
Dimensions : Dimension1, Dimension2
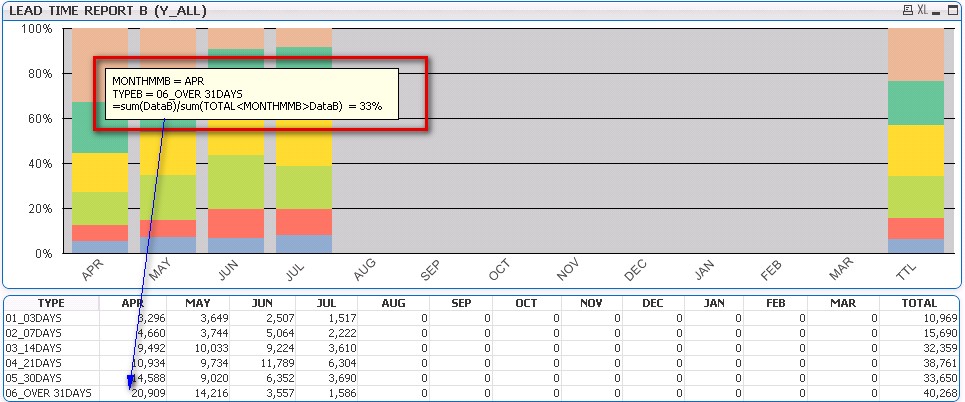
Expression: =Sum(MeasureName)/ Sum(TOTAL <Dimension1> MeasureName)
and in Number tab select Integer and Show in Percent(%) options.
Regards,
Jagan.
- Mark as New
- Bookmark
- Subscribe
- Mute
- Subscribe to RSS Feed
- Permalink
- Report Inappropriate Content
- Mark as New
- Bookmark
- Subscribe
- Mute
- Subscribe to RSS Feed
- Permalink
- Report Inappropriate Content
Hi,
Please find attached file for solution.
Dimensions : Dimension1, Dimension2
Expression: =Sum(MeasureName)/ Sum(TOTAL <Dimension1> MeasureName)
and in Number tab select Integer and Show in Percent(%) options.
Regards,
Jagan.
- Mark as New
- Bookmark
- Subscribe
- Mute
- Subscribe to RSS Feed
- Permalink
- Report Inappropriate Content
Hi Thank you it works like a gem.
One more thing can I change the value on tool tip instead of 33% the actual value 20,909 for this example?
- Mark as New
- Bookmark
- Subscribe
- Mute
- Subscribe to RSS Feed
- Permalink
- Report Inappropriate Content
Hi,
Add another expression
Expression: =Sum(MeasureName) and select Text as Popup in
Chart Properties -> Expression tab.
Regards,
jagan.
- Mark as New
- Bookmark
- Subscribe
- Mute
- Subscribe to RSS Feed
- Permalink
- Report Inappropriate Content
Thank you so much.
- Mark as New
- Bookmark
- Subscribe
- Mute
- Subscribe to RSS Feed
- Permalink
- Report Inappropriate Content
Hello Guys,
I have a similar issue, but not the same. The data I have is arranged in a different way, and I can't figure out a way to make this solution work for my situation.
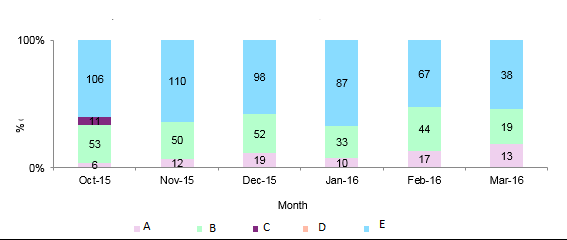
So my data looks like so:
| Month | A | B | C | D | E |
| Oct-15 | 6 | 53 | 11 | 106 | |
| Nov-15 | 12 | 50 | 110 | ||
| Dec-15 | 19 | 52 | 98 | ||
| Jan-16 | 10 | 33 | 87 | ||
| Feb-16 | 17 | 44 | 67 | ||
| Mar-16 | 13 | 19 | 38 |
I would like to use the Y axis to display the stacked values of columns A to E, but I want to all of those to fill it to 100%.
It should look something like this (I have this graph in Excel, but I can't figure out how to build it in QV)
- Mark as New
- Bookmark
- Subscribe
- Mute
- Subscribe to RSS Feed
- Permalink
- Report Inappropriate Content
I actually figured it out myself, after 2 days of trying out different things 
Here is the formula I used for each of the Expressions:
For A:
sum(A)/(sum(TOTAL<Month> A)
+ Sum(TOTAL <Month> B)
+ Sum(TOTAL <Month> C)
+ Sum(TOTAL <Month> D)
+ Sum(TOTAL <Month> E))
For B:
sum(B)/(sum(TOTAL<Month> A)
+ Sum(TOTAL <Month> B)
+ Sum(TOTAL <Month> C)
+ Sum(TOTAL <Month> D)
+ Sum(TOTAL <Month> E))
And so on ...
I also set each of the Expressions to Integer and Show in percentage in the Number tab.
Now, the only thing left to figure out is how to show the actual numbers in the bar chart, instead of percentages.
I'd appreciate it, if you can help me with this one.
- Mark as New
- Bookmark
- Subscribe
- Mute
- Subscribe to RSS Feed
- Permalink
- Report Inappropriate Content
You should not use like this you have to use crosstable() to transform the data so that you can easily achieve this. I am not sure of displaying numbers in Bars when you are calculating percentages.
Regards,
Jagan.