Unlock a world of possibilities! Login now and discover the exclusive benefits awaiting you.
- Qlik Community
- :
- All Forums
- :
- QlikView App Dev
- :
- Re: How can I do running total for the previous 12...
- Subscribe to RSS Feed
- Mark Topic as New
- Mark Topic as Read
- Float this Topic for Current User
- Bookmark
- Subscribe
- Mute
- Printer Friendly Page
- Mark as New
- Bookmark
- Subscribe
- Mute
- Subscribe to RSS Feed
- Permalink
- Report Inappropriate Content
How can I do running total for the previous 12 months for each month in a straight table?
Hello!
I have a straight table like this in my data:
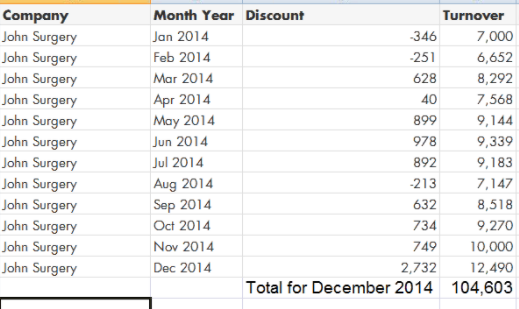
What I would like to show is running total for each month based on the previous 12 months.
For example, in the above example I want to show 104,603 in the Dec 2014 Turnover column.
I have two Dimensions above (Company and Month Year).
Does anyone know how to do this please? If there are no previous months data it should say 'No previous 12 months data'.
Any help would be great 
- Mark as New
- Bookmark
- Subscribe
- Mute
- Subscribe to RSS Feed
- Permalink
- Report Inappropriate Content
Hi John,
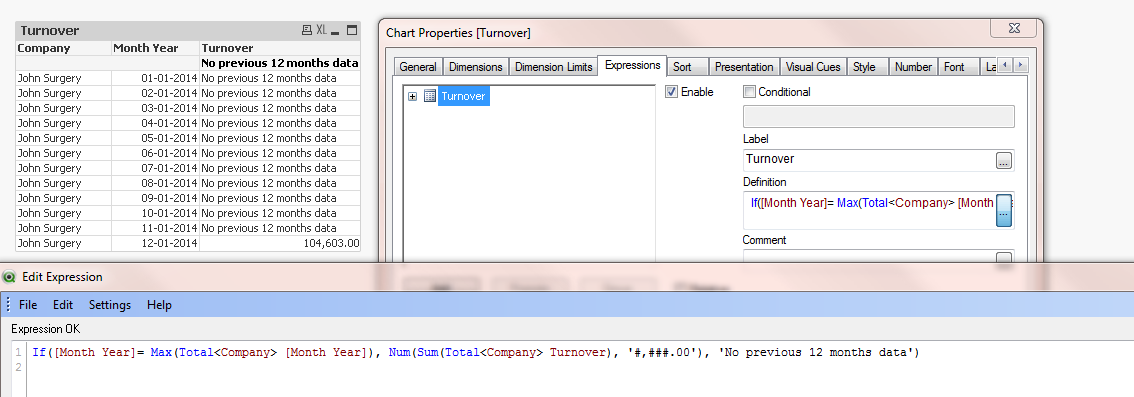
Please see the below screenshot:
Hope this helps.
Thanks
- Mark as New
- Bookmark
- Subscribe
- Mute
- Subscribe to RSS Feed
- Permalink
- Report Inappropriate Content
Hi Sinan,
Thanks for replying back. Your answer is partially true. What should happen is it should show running totals. I.e. for November it should show the 12 months before added up all together.
Any idea how I can do that?
I managed to get this working:
sum(aggr(rangesum( above($(Turnover),0,12) ),Company,MonthYear))
However this expression starts responding to selections (i.e. if I select December 2014 it shows the total as 12,490 as per my original screenshot and not the total for 12 months Turnover added up together.
Anyone have idea how to get it to that?
- Mark as New
- Bookmark
- Subscribe
- Mute
- Subscribe to RSS Feed
- Permalink
- Report Inappropriate Content
You mean like this:
I named your expression as John's Expression
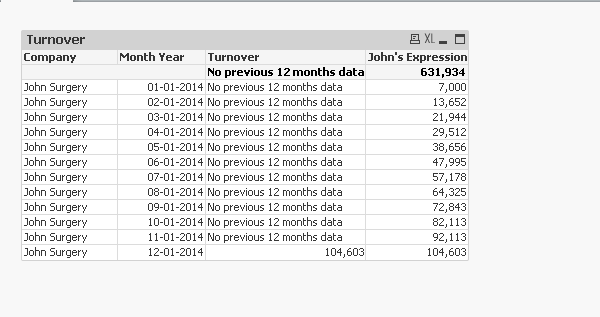
When you make a selection, it only shows the running totals for that month:
It kept the November running total.
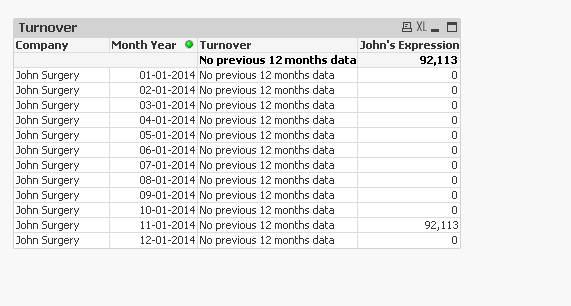
And the expression is:
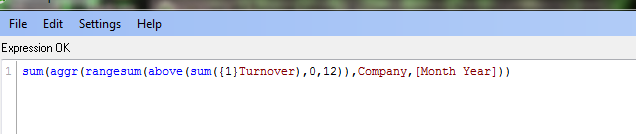
In my original expression, you can put {1} in the aggregations:

Hope this helps.