Unlock a world of possibilities! Login now and discover the exclusive benefits awaiting you.
- Qlik Community
- :
- All Forums
- :
- QlikView App Dev
- :
- How can I link charts' dimensions? (or put a stack...
- Subscribe to RSS Feed
- Mark Topic as New
- Mark Topic as Read
- Float this Topic for Current User
- Bookmark
- Subscribe
- Mute
- Printer Friendly Page
- Mark as New
- Bookmark
- Subscribe
- Mute
- Subscribe to RSS Feed
- Permalink
- Report Inappropriate Content
How can I link charts' dimensions? (or put a stacked bar chart in a table?)
I want to display some stacked values in a bar chart, along with their overall percentage variation relative to the previous time period.
Option 1: include something like the bars below into a straight table. I wouldn't know how to do it using simple linear gauges. Any tips?
I 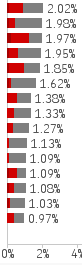
Option 2: alternatively, I can just have two bar charts: one with the values above and one with the time variation; however, the dimesions of the charts should be linked. I tried by inputting the expression of one chart as sorting expression of the other, but zero or negative values are not sorted correctly and always appear at the bottom. Moreover, filtering zero values would not work correctly: a value with no percentage variation wouldn't show up, while I'd want to filter out the zero values of the sorting expression.
Any idea how I can visualise all the info above in a consistent way?
Thanks,
Luca
- Mark as New
- Bookmark
- Subscribe
- Mute
- Subscribe to RSS Feed
- Permalink
- Report Inappropriate Content
 Hello, Luca.
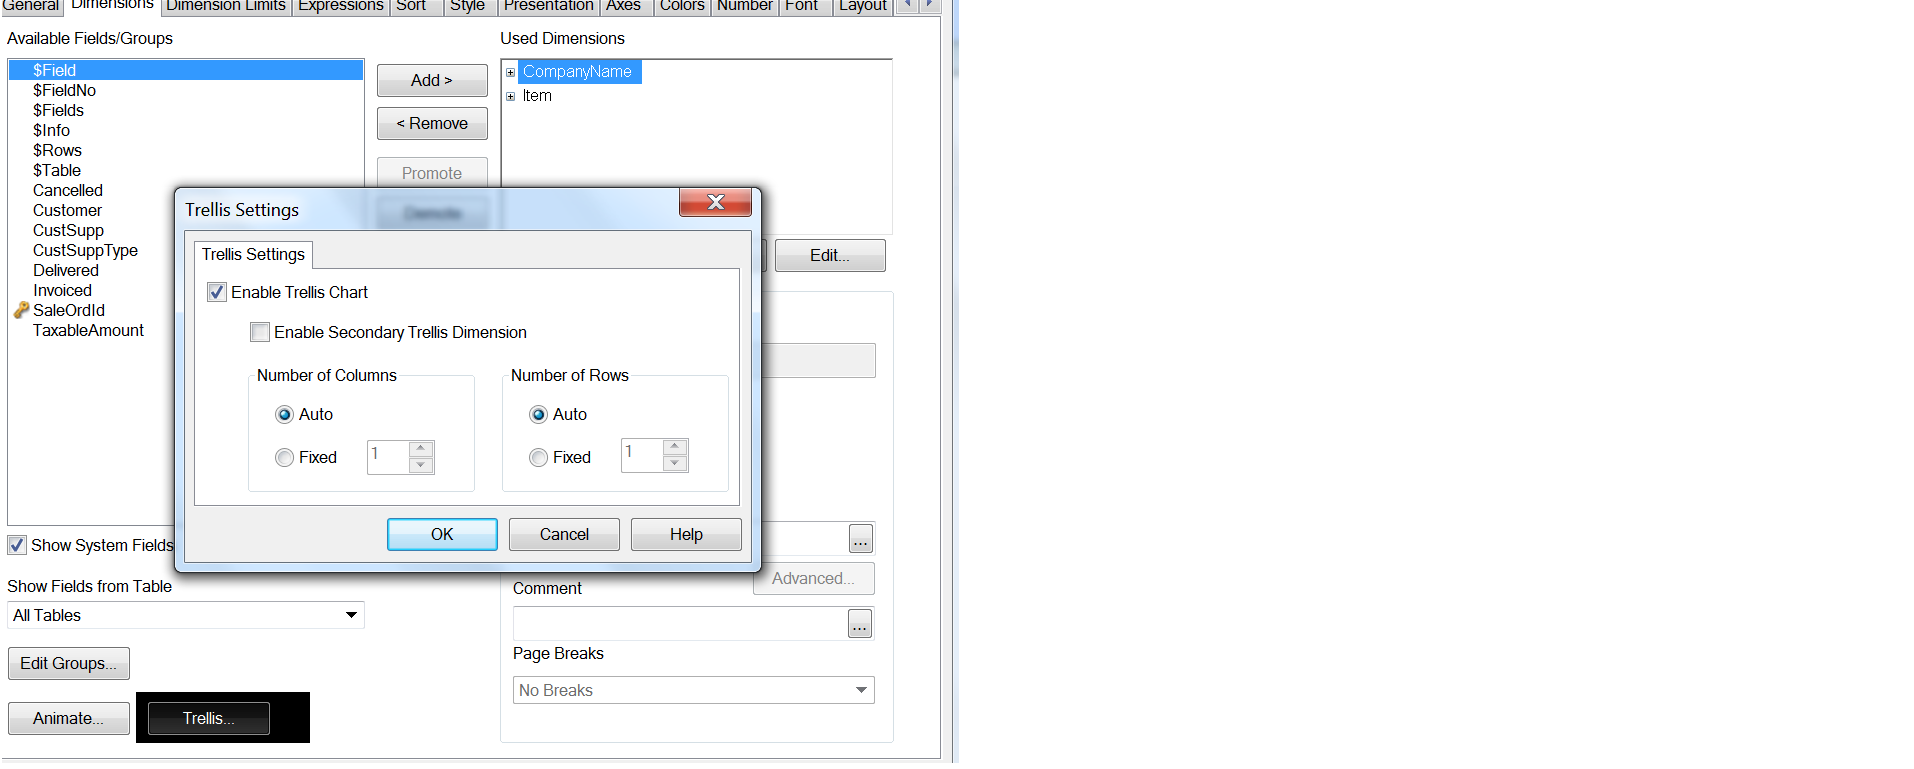
In first case, you can use Trellis Options. You can see in attached picture file "Trellis".
In the second case you can use tab "Axes" for the right and left position of dimension. And tab "Presentation" for the Zero Values.