Unlock a world of possibilities! Login now and discover the exclusive benefits awaiting you.
Announcements
Save $650 on Qlik Connect, Dec 1 - 7, our lowest price of the year. Register with code CYBERWEEK: Register
- Qlik Community
- :
- All Forums
- :
- QlikView App Dev
- :
- Re: How can I make the line of a line chart dashed...
Options
- Subscribe to RSS Feed
- Mark Topic as New
- Mark Topic as Read
- Float this Topic for Current User
- Bookmark
- Subscribe
- Mute
- Printer Friendly Page
Turn on suggestions
Auto-suggest helps you quickly narrow down your search results by suggesting possible matches as you type.
Showing results for
Creator III
2017-11-27
04:39 AM
- Mark as New
- Bookmark
- Subscribe
- Mute
- Subscribe to RSS Feed
- Permalink
- Report Inappropriate Content
How can I make the line of a line chart dashed?
hi,
I have below question described in the below image. Please help me for that.
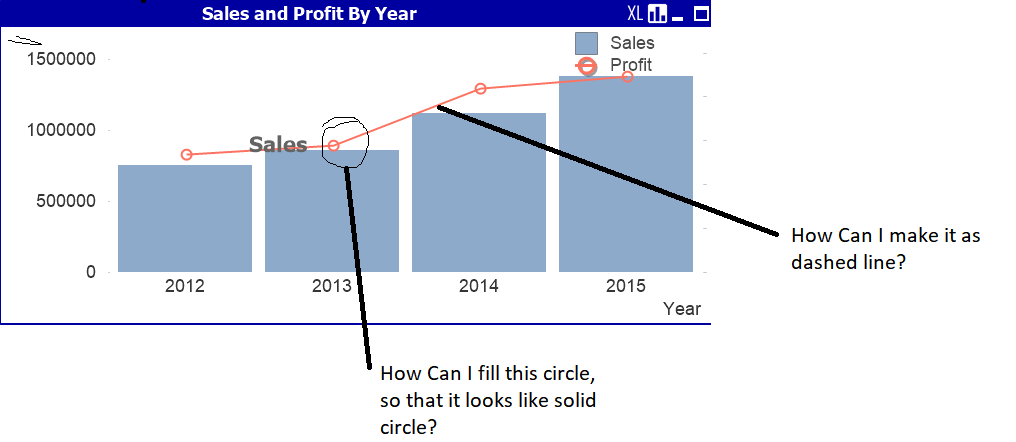
I have used 2 expression as : Sum(Sales) for bar chart and sum(Profit) for line chart. My intention is show Label 'Sales' at the left side along side the left Y axis and 'Profit' at the right side of the chart along side the right of Y axis like below image:

- Tags:
- line chart
693 Views
1 Solution
Accepted Solutions
Champion III
2017-11-27
04:55 AM
- Mark as New
- Bookmark
- Subscribe
- Mute
- Subscribe to RSS Feed
- Permalink
- Report Inappropriate Content
you have multiple options with line style, try them all 
<s1>
<s2>
<S3>
<s4>
Vineeth Pujari
If a post helps to resolve your issue, please accept it as a Solution.
If a post helps to resolve your issue, please accept it as a Solution.
3 Replies
Master III
2017-11-27
04:49 AM
- Mark as New
- Bookmark
- Subscribe
- Mute
- Subscribe to RSS Feed
- Permalink
- Report Inappropriate Content
set line style of the expression to ='<S2>'
Champion III
2017-11-27
04:55 AM
- Mark as New
- Bookmark
- Subscribe
- Mute
- Subscribe to RSS Feed
- Permalink
- Report Inappropriate Content
you have multiple options with line style, try them all
<s1>
<s2>
<S3>
<s4>
Vineeth Pujari
If a post helps to resolve your issue, please accept it as a Solution.
If a post helps to resolve your issue, please accept it as a Solution.
Creator III
2017-11-27
05:20 AM
Author
- Mark as New
- Bookmark
- Subscribe
- Mute
- Subscribe to RSS Feed
- Permalink
- Report Inappropriate Content
Hi,
I have achieved my first 2 points. But what I have to do for 2nd points:
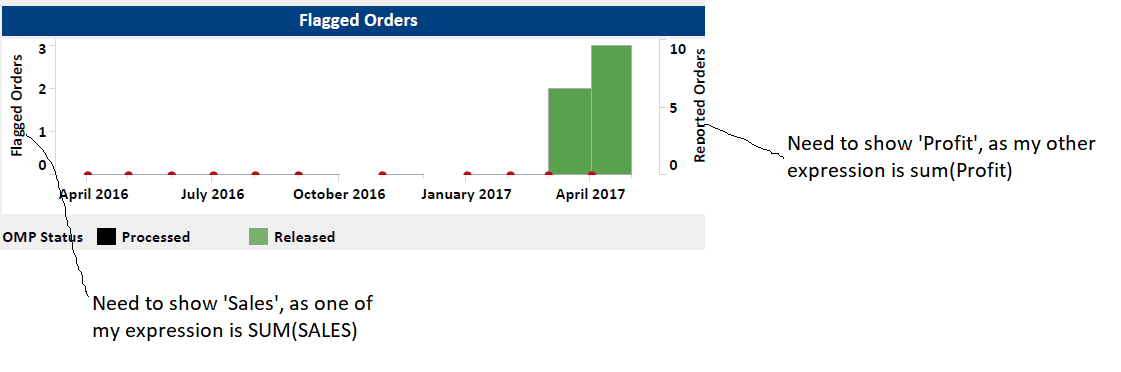
596 Views