Unlock a world of possibilities! Login now and discover the exclusive benefits awaiting you.
- Qlik Community
- :
- All Forums
- :
- QlikView App Dev
- :
- How can I remove white space from either side of m...
- Subscribe to RSS Feed
- Mark Topic as New
- Mark Topic as Read
- Float this Topic for Current User
- Bookmark
- Subscribe
- Mute
- Printer Friendly Page
- Mark as New
- Bookmark
- Subscribe
- Mute
- Subscribe to RSS Feed
- Permalink
- Report Inappropriate Content
How can I remove white space from either side of my chart?
Not such a big issue in the below example, however in some instances this half inch either side is affecting how legible the chart is.
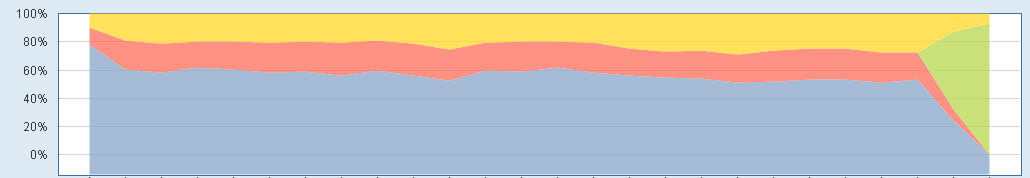
Is there a way to remove the forced white space in the plot area? Holding Ctrl+Shift and re-sizing the red boxes don't work as it's inside the box that I want to change.
Thanks
Accepted Solutions
- Mark as New
- Bookmark
- Subscribe
- Mute
- Subscribe to RSS Feed
- Permalink
- Report Inappropriate Content
You can't completely remove the white space afaik. You can try setting the x-axis to continous and use the static min and static max options to limit the range of the axis. Though that only works if you have a numeric dimension on you x-axis in the first place. And you will still have a small amount of white space on either side of the plot area.
talk is cheap, supply exceeds demand
- Mark as New
- Bookmark
- Subscribe
- Mute
- Subscribe to RSS Feed
- Permalink
- Report Inappropriate Content
Hi Gysbert,
Thanks for your answer, albeit a disappointing one. It's a shame the white space is not relative to chart size, as when I fake a spark-line the white space is taking up almost half of my plot area.
Thanks again.