Unlock a world of possibilities! Login now and discover the exclusive benefits awaiting you.
- Qlik Community
- :
- All Forums
- :
- QlikView App Dev
- :
- Re: How can I show only every 10th value on x axis...
Options
- Subscribe to RSS Feed
- Mark Topic as New
- Mark Topic as Read
- Float this Topic for Current User
- Bookmark
- Subscribe
- Mute
- Printer Friendly Page
Turn on suggestions
Auto-suggest helps you quickly narrow down your search results by suggesting possible matches as you type.
Showing results for
Partner - Creator II
2015-07-19
05:42 AM
- Mark as New
- Bookmark
- Subscribe
- Mute
- Subscribe to RSS Feed
- Permalink
- Report Inappropriate Content
How can I show only every 10th value on x axis?
Hi,
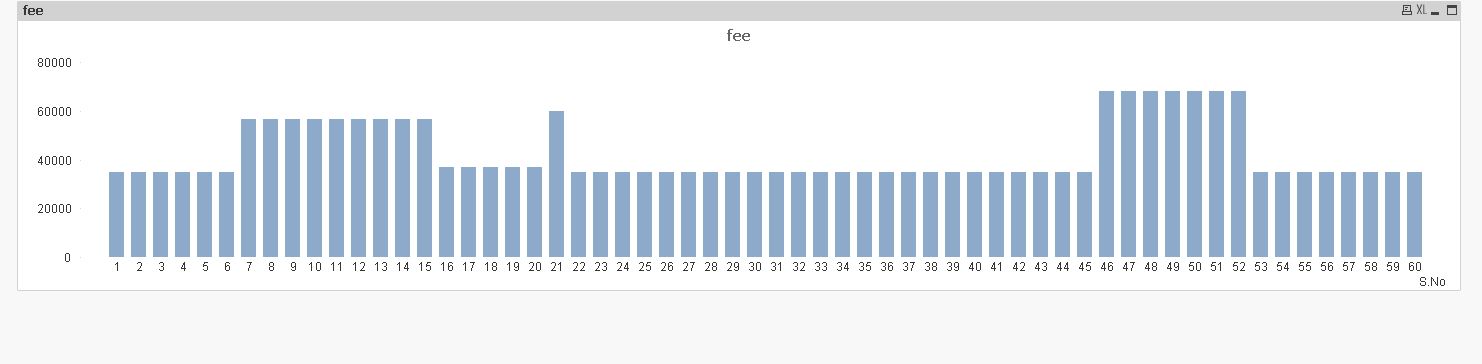
I have big chart with 600 values on the x axis.
is is possible to show only every 10th value, so I will have only 60 values on th x axis als legend
thanks
Bumin
7,087 Views
- « Previous Replies
-
- 1
- 2
- Next Replies »
12 Replies
Not applicable
2015-07-20
04:50 AM
- Mark as New
- Bookmark
- Subscribe
- Mute
- Subscribe to RSS Feed
- Permalink
- Report Inappropriate Content
I got by using simple function, Adding calaculate dimension =If(Mod(S.No,10)=0,S.No).
After Using =If(Mod(S.No,10)=0,S.No) 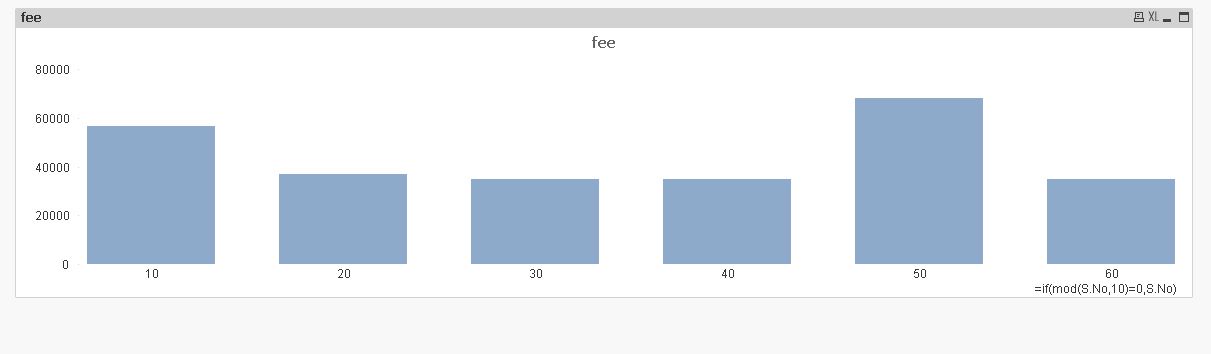
regards,
kalyan.
608 Views
Not applicable
2015-07-20
04:56 AM
- Mark as New
- Bookmark
- Subscribe
- Mute
- Subscribe to RSS Feed
- Permalink
- Report Inappropriate Content
608 Views
Anonymous
Not applicable
2016-12-12
08:33 AM
- Mark as New
- Bookmark
- Subscribe
- Mute
- Subscribe to RSS Feed
- Permalink
- Report Inappropriate Content
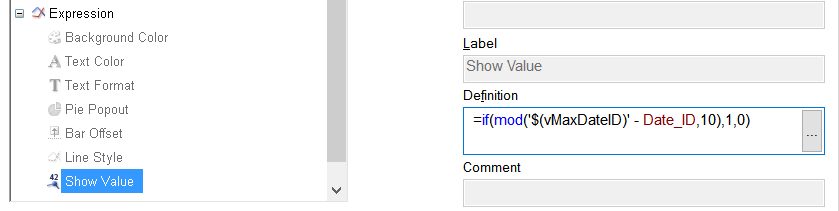
I use the show values associated with the expression. Try:
=if(mod('$(vMaxDateID)' - Date_ID,10),1,0)
where vMaxDateID is variable and your max Date_ID
See pic:
608 Views
- « Previous Replies
-
- 1
- 2
- Next Replies »