Unlock a world of possibilities! Login now and discover the exclusive benefits awaiting you.
- Qlik Community
- :
- All Forums
- :
- QlikView App Dev
- :
- Re: How can I show the count of records in a strai...
- Subscribe to RSS Feed
- Mark Topic as New
- Mark Topic as Read
- Float this Topic for Current User
- Bookmark
- Subscribe
- Mute
- Printer Friendly Page
- Mark as New
- Bookmark
- Subscribe
- Mute
- Subscribe to RSS Feed
- Permalink
- Report Inappropriate Content
How can I show the count of records in a straight table if the selected date falls between two dates
Hello!
I'm new to the Qlik Community and still mostly a beginner with Qlikview in general. I hope to learn quite a bit and also hope to contribute to the conversations as I can.
I'm creating a scorecard dashboard and I'm trying to get the count of IDs in a straight table where the Created Date (which is our dimension) is greater than the Created Date AND less than or equal to the Processed Date.
Let's say I have the following data example:
| ID | CRT_DT | PRC_DT |
|---|---|---|
| 1 | 6/1/16 | 6/1/16 |
| 2 | 6/1/16 | 6/1/16 |
| 3 | 6/1/16 | 6/2/16 |
| 4 | 6/1/16 | 6/1/16 |
| 5 | 6/1/16 | 6/3/16 |
| 6 | 6/1/16 | 6/2/16 |
| 7 | 6/2/16 | 6/2/16 |
| 8 | 6/2/16 | 6/3/16 |
| 9 | 6/2/16 | 6/4/16 |
| 10 | 6/2/16 | 6/3/16 |
| 11 | 6/3/16 | 6/4/16 |
So if this data truly starts on 6/1/16, the count in the straight table for 6/1/16 should be 0. The count in the straight table for 6/2/16 would be 3 (because of ID 3, 5, and 6). The count in the straight table for 6/3/16 would be 4 (because of ID 5, 8, 9, and 10). Finally the count in the straight table for 6/4/16 would be 2 (because of ID 9 and 11).
This is assuming that no dates are filtered. If a user filters on a particular date and the table shows only 1 row for that date, the count should still be the same as well. Example: Using the data example above, if a user filters on 6/3/16, the 1 row should still show a count of 4.
The straight table is using the CRT_DT as the dimension as well, so I'm not sure if that is an issue?
I may be overcomplicating this or not looking at how to write this out in a simpler way, but I could really use the help!
Thanks!
Accepted Solutions
- Mark as New
- Bookmark
- Subscribe
- Mute
- Subscribe to RSS Feed
- Permalink
- Report Inappropriate Content
Hi,
Find the solution.
Regards,
Kaushik Solanki
- Mark as New
- Bookmark
- Subscribe
- Mute
- Subscribe to RSS Feed
- Permalink
- Report Inappropriate Content
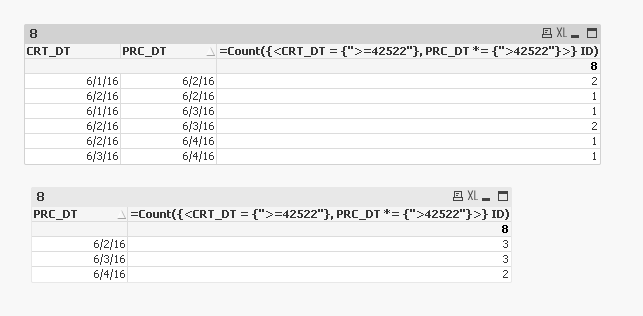
Are you looking to get one of these?
- Mark as New
- Bookmark
- Subscribe
- Mute
- Subscribe to RSS Feed
- Permalink
- Report Inappropriate Content
Hi,
Find the solution.
Regards,
Kaushik Solanki
- Mark as New
- Bookmark
- Subscribe
- Mute
- Subscribe to RSS Feed
- Permalink
- Report Inappropriate Content
Hi Sunny,
This seems very close to what I'm wanting to show. However, it seems to not display the correct IDs based off the criteria in my original post:
"So if this data truly starts on 6/1/16, the count in the straight table for 6/1/16 should be 0. The count in the straight table for 6/2/16 would be 3 (because of ID 3, 5, and 6). The count in the straight table for 6/3/16 would be 4 (because of ID 5, 8, 9, and 10). Finally the count in the straight table for 6/4/16 would be 2 (because of ID 9 and 11)."
For example, if I click on the processed date of 6/2/16 from the example you provided, it shows that this is a result of ID 3, 6 and 7 instead of ID 3, 5 and 6. Also, 6/3/16 only shows only 3 IDs (5, 8, and 10) instead of the 4 IDs (5, 8, 9, and 10).
I will work with the example you provided (which if VERY helpful!) and see if I can modify it to show the results based off the criteria above.
Thanks,
- Mark as New
- Bookmark
- Subscribe
- Mute
- Subscribe to RSS Feed
- Permalink
- Report Inappropriate Content
Hi,
Did you check the solution I gave. Did it work for you. If not let me know what is going wrong.
Regards,
Kaushik Solanki
- Mark as New
- Bookmark
- Subscribe
- Mute
- Subscribe to RSS Feed
- Permalink
- Report Inappropriate Content
Hi Kaushik,
My apologies. I was thinking the solution was from Sunny. The solution seems pointing in the right direction, but the issue I'm facing is how I can actually display this data. As I think through this, I don't think that CRT_DT or PRC_DT should be the dimension. I wonder if I should actually create a master calendar with the Min date as the CRT_DT and the Max date as the PRC_DT? I could then use the master calendar as the dimension. What I can then show is number of IDs based off of the criteria I mentioned in my original post.
If I use a master calendar, I could have it displayed as such:

And the data model looks like this:

In the 2nd chart where RCD_DT would be the dimension, is it possible to show the number of IDs from "Table" using the criteria mentioned in the original post? So 6/1/2016 would be a count of 0, 6/2/2016 would be a count of 3, 6/3/2016 would be a count of 4, and 6/4/2016 would be a count of 2?
Hopefully this will help to clarify how I am trying to show this information.
Thanks!
- Mark as New
- Bookmark
- Subscribe
- Mute
- Subscribe to RSS Feed
- Permalink
- Report Inappropriate Content
I think once again you are not looking at Kaushik's response. Check here to see his attached qvw:Re: How can I show the count of records in a straight table if the selected date falls between two d...
- Mark as New
- Bookmark
- Subscribe
- Mute
- Subscribe to RSS Feed
- Permalink
- Report Inappropriate Content
Very odd, I must have opened up a different solution when I was thinking I was actually opening Kaushik's solution. I'm so sorry for the confusion. YES! The solution Kaushik provided is definitely what I'm looking to get at. This is perfect! Thank you guys for the help. It is very much appreciated!
- Mark as New
- Bookmark
- Subscribe
- Mute
- Subscribe to RSS Feed
- Permalink
- Report Inappropriate Content
Thank you Kaushik! I'm still learning to navigate around the forums here. I think I downloaded the wrong file previously. Your solution is exactly what I'm looking for! THANK YOU!