Unlock a world of possibilities! Login now and discover the exclusive benefits awaiting you.
- Qlik Community
- :
- All Forums
- :
- QlikView App Dev
- :
- Re: How create specific chart
- Subscribe to RSS Feed
- Mark Topic as New
- Mark Topic as Read
- Float this Topic for Current User
- Bookmark
- Subscribe
- Mute
- Printer Friendly Page
- Mark as New
- Bookmark
- Subscribe
- Mute
- Subscribe to RSS Feed
- Permalink
- Report Inappropriate Content
How create specific chart
Hello,
I'm beginner of QlikView.
I have a problem to create chart.
I want display lastYear column and lastHalfYear column and one year eariler second column. All in one chart.
My aim is in attachment.
I try add calculated dimension.
= if (right(halfYear, 4)='2013', dual(Year(Today())-2,Year),
if (right(halfYear, 2)='6/', dual('YTD'&halfYear,halfYear) ))
Should I in different way read data?
Thanks for help!
Daniel
- Mark as New
- Bookmark
- Subscribe
- Mute
- Subscribe to RSS Feed
- Permalink
- Report Inappropriate Content
Provide sample data.. will try to work on this..
- Mark as New
- Bookmark
- Subscribe
- Mute
- Subscribe to RSS Feed
- Permalink
- Report Inappropriate Content
Sample data.
Dimension time
For every type(in example data only one) caluclate SUM(amount*price).
- Mark as New
- Bookmark
- Subscribe
- Mute
- Subscribe to RSS Feed
- Permalink
- Report Inappropriate Content
Here is a sample
let me know if you are unable to open the QVW
- Mark as New
- Bookmark
- Subscribe
- Mute
- Subscribe to RSS Feed
- Permalink
- Report Inappropriate Content
I can't open this document. I don't have named user cal license.
- Mark as New
- Bookmark
- Subscribe
- Mute
- Subscribe to RSS Feed
- Permalink
- Report Inappropriate Content
Ok. so my script is:
LOAD year,
month,
yearMonth,
halfYear,
quarter,
// [code ] as Code,
productName,
amount,
price
FROM
(txt, codepage is 1252, embedded labels, delimiter is ',', msq);
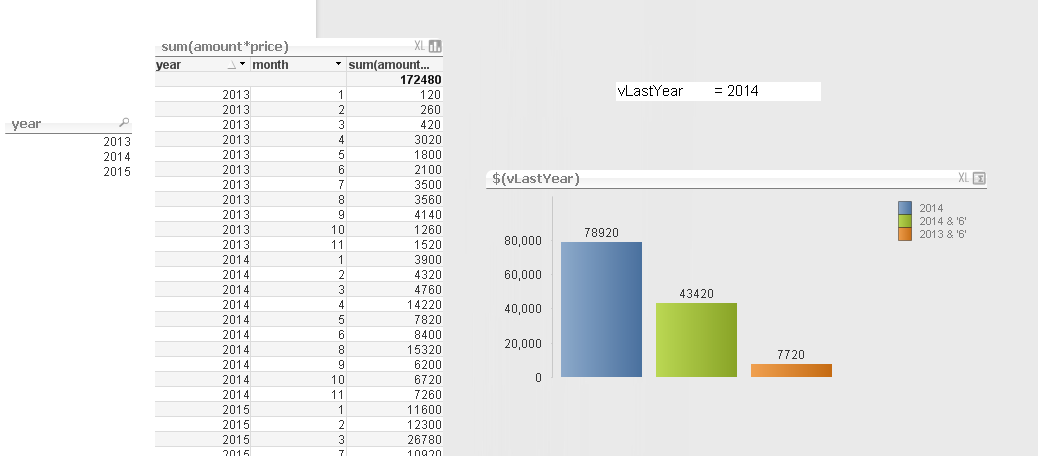
i have a variable vLastYear with an expression: =max({1} year)-1
And my chart has no dimensions and 3 expressions .
Expression 1; sum( {$<year={$(vLastYear)}>} amount * price)
Expression 2: sum( {$<year={$(vLastYear)},month={"<=6"}>} amount * price)
Expresion 3: sum( {$<year={$(=vLastYear-1)},month={"<=6"}>} amount * price)
you can also put an expression in the label too:
Expression 1 label: $(vLastYear)
Expression 2 label: $(vLastYear) & '6'
Expression 3 label: $(=vLastYear-1) & '6'
- Mark as New
- Bookmark
- Subscribe
- Mute
- Subscribe to RSS Feed
- Permalink
- Report Inappropriate Content
Thank you for answer.
I have another one question.
When product have 3 different code and I want create stacked chart.
For example:
Clik 2013
Chart have main bar with sum for 2013 for stacked 3 different codes.
Different bars have stacked value for YTD2013, YTD2014, YTD2015
- Mark as New
- Bookmark
- Subscribe
- Mute
- Subscribe to RSS Feed
- Permalink
- Report Inappropriate Content
Aim is in *.png file in first post.
Anyone can help?
- Mark as New
- Bookmark
- Subscribe
- Mute
- Subscribe to RSS Feed
- Permalink
- Report Inappropriate Content
You can use the same script, but you need to add a synthetic dimension and instead of 3 expressions, use 1 conditional expression:
1. Add a new 'calculated dimension' to the chart and promote it to be the first dimension. The formula for the calcualted dimension will be a synthetic dimension as follows:
=ValueList('CurYear','LastYearYTD','2YearsYTD')
Also add a product dimension and ensure its 2nd (from the top) in the list.
2. Delete all the expressions and add a new expression with the following conditional formula
if(ValueList('CurYear','LastYearYTD','2YearsYTD')='CurYear',
sum( {$<year={$(vLastYear)}>} amount * price) ,
if( ValueList('CurYear','LastYearYTD','2YearsYTD') = 'LastYearYTD',
sum( {$<year={$(vLastYear)},month={"<=6"}>} amount * price) ,
sum( {$<year={$(=vLastYear-1)},month={"<=6"}>} amount * price)
)
)
You can also put the following dynamic label formula:
=if( ValueList('CurYear','LastYearYTD','2YearsYTD')='CurYear',
$(vLastYear) ,
if( ValueList('CurYear','LastYearYTD','2YearsYTD') = 'LastYearYTD',
$(=vLastYear-1) & ' - 6' ,
$(=vLastYear-2) & ' - 6'
)
)
3. on the style tab, change from 'grouped' to 'stacked'
