Unlock a world of possibilities! Login now and discover the exclusive benefits awaiting you.
- Qlik Community
- :
- All Forums
- :
- QlikView App Dev
- :
- How do I Set Sort Order in chart with Calculated ...
- Subscribe to RSS Feed
- Mark Topic as New
- Mark Topic as Read
- Float this Topic for Current User
- Bookmark
- Subscribe
- Mute
- Printer Friendly Page
- Mark as New
- Bookmark
- Subscribe
- Mute
- Subscribe to RSS Feed
- Permalink
- Report Inappropriate Content
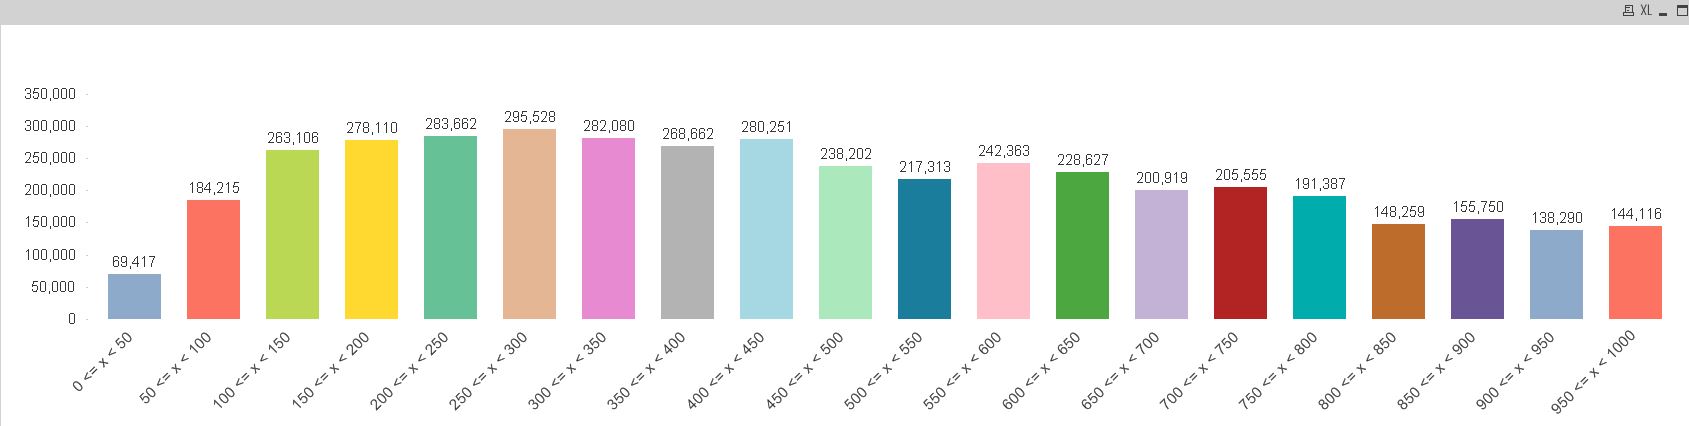
How do I Set Sort Order in chart with Calculated Dimension?
I have created a chart with calculated DImension
The chart shown below
The calculated Dimension is as follows
=Replace(class(POINTS,$(vClassVol)),'<= x <', ' - ')
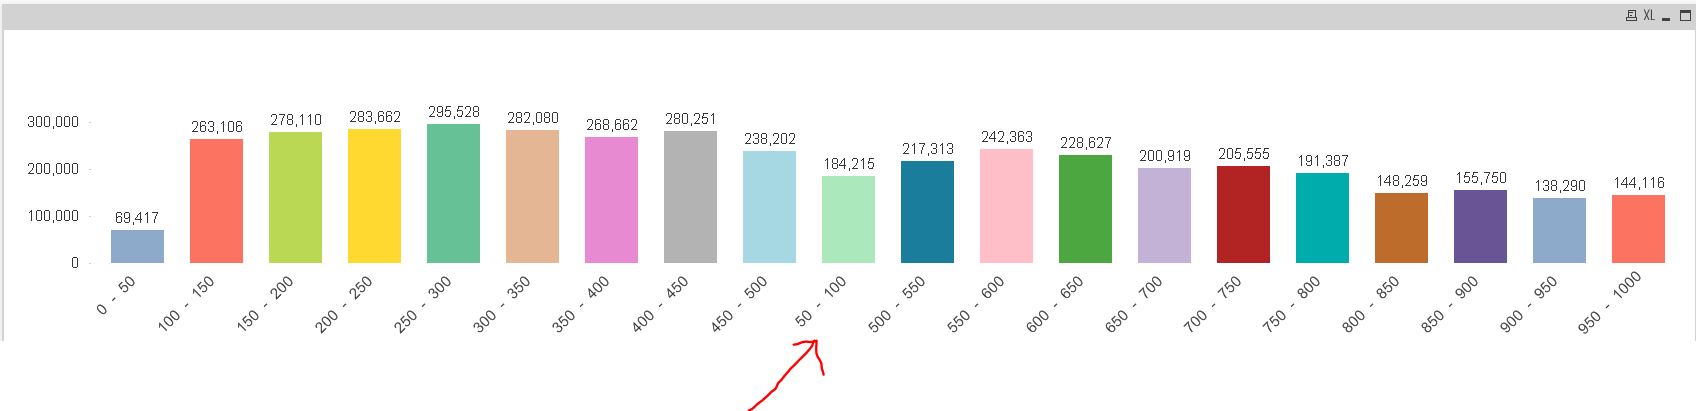
How do I set the sort order so that the 50-100 after 0-100
Thank you
- « Previous Replies
-
- 1
- 2
- Next Replies »
Accepted Solutions
- Mark as New
- Bookmark
- Subscribe
- Mute
- Subscribe to RSS Feed
- Permalink
- Report Inappropriate Content
Try below as calculated dimension
=DUAL(Replace(class(POINTS,$(vClassVol)),'<= x <', ' - '),class(POINTS,$(vClassVol)))
Now go to sort expression and use Number by Ascending or Descending Order
- Mark as New
- Bookmark
- Subscribe
- Mute
- Subscribe to RSS Feed
- Permalink
- Report Inappropriate Content
Can you upload a sample qvw???
- Mark as New
- Bookmark
- Subscribe
- Mute
- Subscribe to RSS Feed
- Permalink
- Report Inappropriate Content
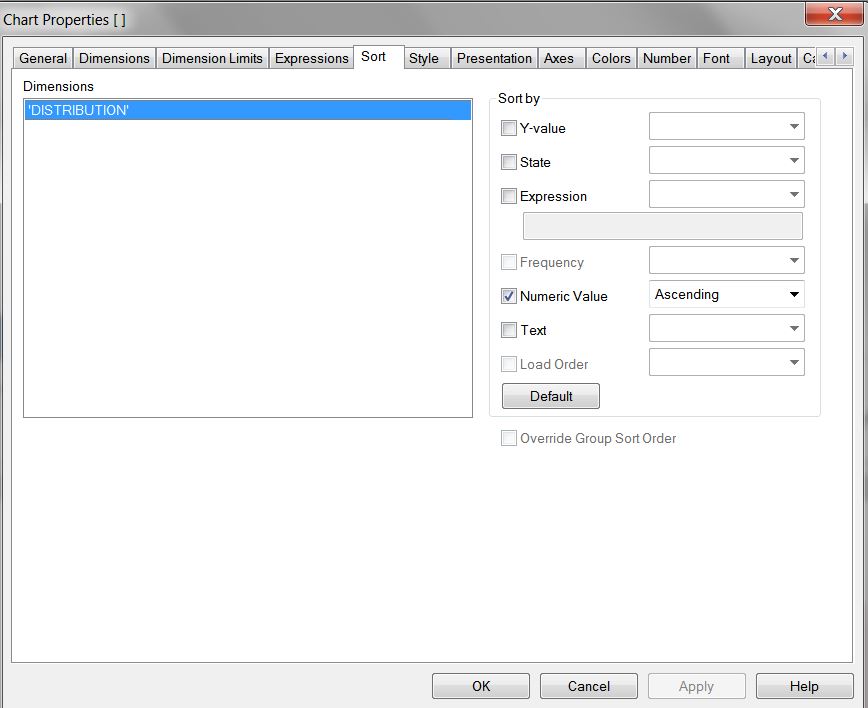
Go to the sort tab, and for calulated dimension click on
Numeric value--> Ascending option.
I t will automatically sort the calulated dimension as per the numenric values.
Hope this will help you...!!!
- Mark as New
- Bookmark
- Subscribe
- Mute
- Subscribe to RSS Feed
- Permalink
- Report Inappropriate Content
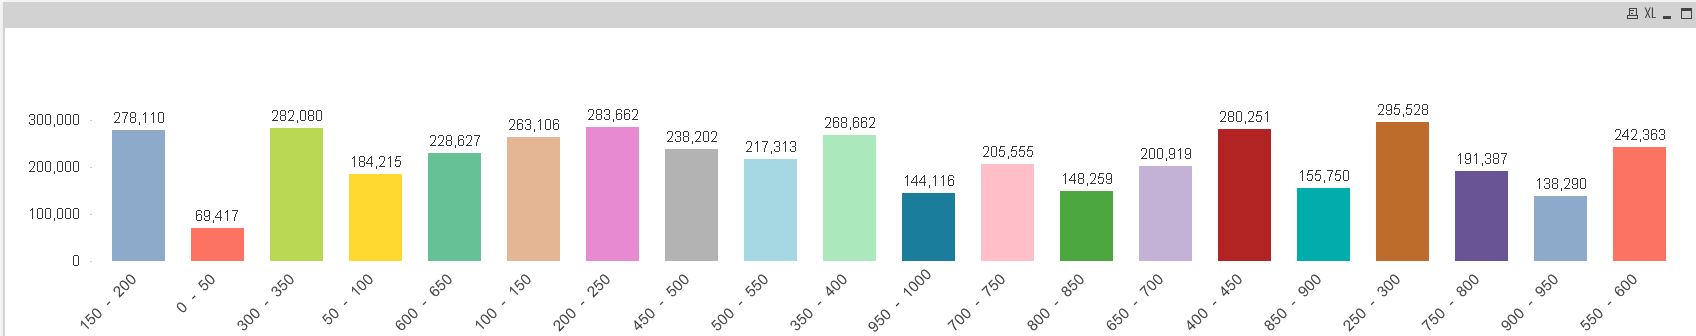
Hi Priya Sane
Thanks I have tried. The result as follow. I am not getting the correct chart
- Mark as New
- Bookmark
- Subscribe
- Mute
- Subscribe to RSS Feed
- Permalink
- Report Inappropriate Content
Could you try the same sort for Numeric value by removing the 'Replace' clause in your calculated dimension and check whether its working or not.
- Mark as New
- Bookmark
- Subscribe
- Mute
- Subscribe to RSS Feed
- Permalink
- Report Inappropriate Content
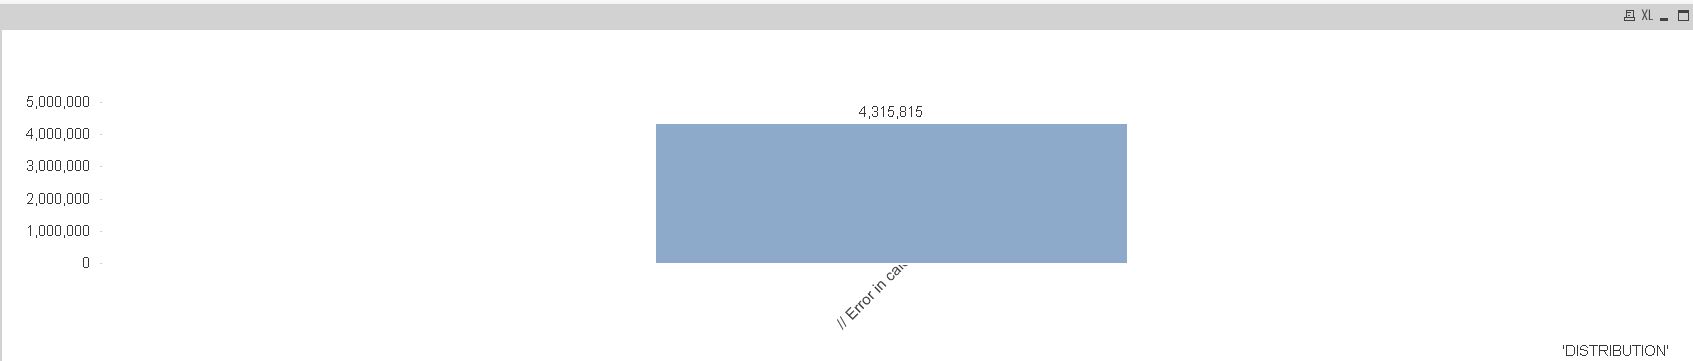
I have tried. Qlikview says Error
The dimension as follows ==(class(POINTS,$(vClassVol)),'<= x <', ' - ')
- Mark as New
- Bookmark
- Subscribe
- Mute
- Subscribe to RSS Feed
- Permalink
- Report Inappropriate Content
write
class(POINTS,$(vClassVol)) as calculated dimension and try
or the other option is write your same expression you have written in calculated dimension in your Sort tab--> Expression field.
- Mark as New
- Bookmark
- Subscribe
- Mute
- Subscribe to RSS Feed
- Permalink
- Report Inappropriate Content
Hi,
Try:
=Replace(class(POINTS,$(vClassVol)),'<= x <', '0')
in sorting Expression and select ascending.
i.e replace '<= x <' with 0 in sorting expression.
- Mark as New
- Bookmark
- Subscribe
- Mute
- Subscribe to RSS Feed
- Permalink
- Report Inappropriate Content
Try below as calculated dimension
=DUAL(Replace(class(POINTS,$(vClassVol)),'<= x <', ' - '),class(POINTS,$(vClassVol)))
Now go to sort expression and use Number by Ascending or Descending Order
- Mark as New
- Bookmark
- Subscribe
- Mute
- Subscribe to RSS Feed
- Permalink
- Report Inappropriate Content
Priya,
I have tried using the calculated dimension expression in sort expression. I am getting the same chart as what I posted in my first request
How ever if I use the expression class(POINTS,$(vClassVol)) It does solves but the x axis labeling is different
Thanks. Manish suggestion worked the way I want. Your suggestion is alternate.
- « Previous Replies
-
- 1
- 2
- Next Replies »