Unlock a world of possibilities! Login now and discover the exclusive benefits awaiting you.
- Qlik Community
- :
- All Forums
- :
- QlikView App Dev
- :
- How do I add a filter across multiple charts?
- Subscribe to RSS Feed
- Mark Topic as New
- Mark Topic as Read
- Float this Topic for Current User
- Bookmark
- Subscribe
- Mute
- Printer Friendly Page
- Mark as New
- Bookmark
- Subscribe
- Mute
- Subscribe to RSS Feed
- Permalink
- Report Inappropriate Content
How do I add a filter across multiple charts?
Hello,
Very new to Qlikview and need help.
I have conducted a survey of 4 teams. They were asked 5 questions each of which had 6 choices.
A snapshot of the results are in the attached table.
I have built a dashboard with 5 charts representing results from each of the 5 questions. These charts reflect results for all respondents i.e overall results.
Here's where I need help - I would like to add a Team filter where I can select a team, and all the 5 charts then reflect results of responses from respondents belonging to that team.
Thanks!
Accepted Solutions
- Mark as New
- Bookmark
- Subscribe
- Mute
- Subscribe to RSS Feed
- Permalink
- Report Inappropriate Content
- Mark as New
- Bookmark
- Subscribe
- Mute
- Subscribe to RSS Feed
- Permalink
- Report Inappropriate Content
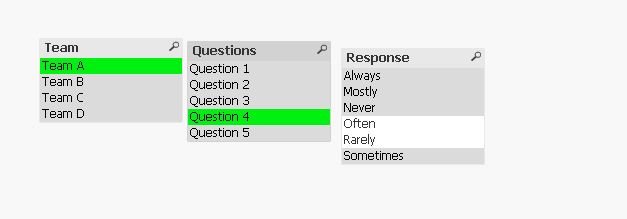
Add a listbox object for the Team field and then use that listbox to select the team.
talk is cheap, supply exceeds demand
- Mark as New
- Bookmark
- Subscribe
- Mute
- Subscribe to RSS Feed
- Permalink
- Report Inappropriate Content
You can add a listbox to use as filter, and a table box to show the results grouped by team. See attached.
Regards,
Carlos
- Mark as New
- Bookmark
- Subscribe
- Mute
- Subscribe to RSS Feed
- Permalink
- Report Inappropriate Content
Hi
Also as you are new to Qlik. Please refer the below site , enter with user id and password, you should be able to download some qlikview dashboards for more understanding.
demo.qlik.com
Some of the dashboards will be present in the below folder after installing QlikView.
C:\Program Files\QlikView\Examples\Documents
- Mark as New
- Bookmark
- Subscribe
- Mute
- Subscribe to RSS Feed
- Permalink
- Report Inappropriate Content
like this


- Mark as New
- Bookmark
- Subscribe
- Mute
- Subscribe to RSS Feed
- Permalink
- Report Inappropriate Content
Thanks. I got the Team Listbox working, but can't get the Questions the way you have shown. Your qvw file failed to load for some reason, so I couldn't figure out how you set up the Questions listbox.