Unlock a world of possibilities! Login now and discover the exclusive benefits awaiting you.
- Qlik Community
- :
- All Forums
- :
- QlikView App Dev
- :
- Re: How do I calculate the value of a forecast?
- Subscribe to RSS Feed
- Mark Topic as New
- Mark Topic as Read
- Float this Topic for Current User
- Bookmark
- Subscribe
- Mute
- Printer Friendly Page
- Mark as New
- Bookmark
- Subscribe
- Mute
- Subscribe to RSS Feed
- Permalink
- Report Inappropriate Content
How do I calculate the value of a forecast?
I have a bar chart with data from 2009 to present.
I have a trend line, with forecast going forwards 10 months.
What I need to calculate is the total value for those forecast months.
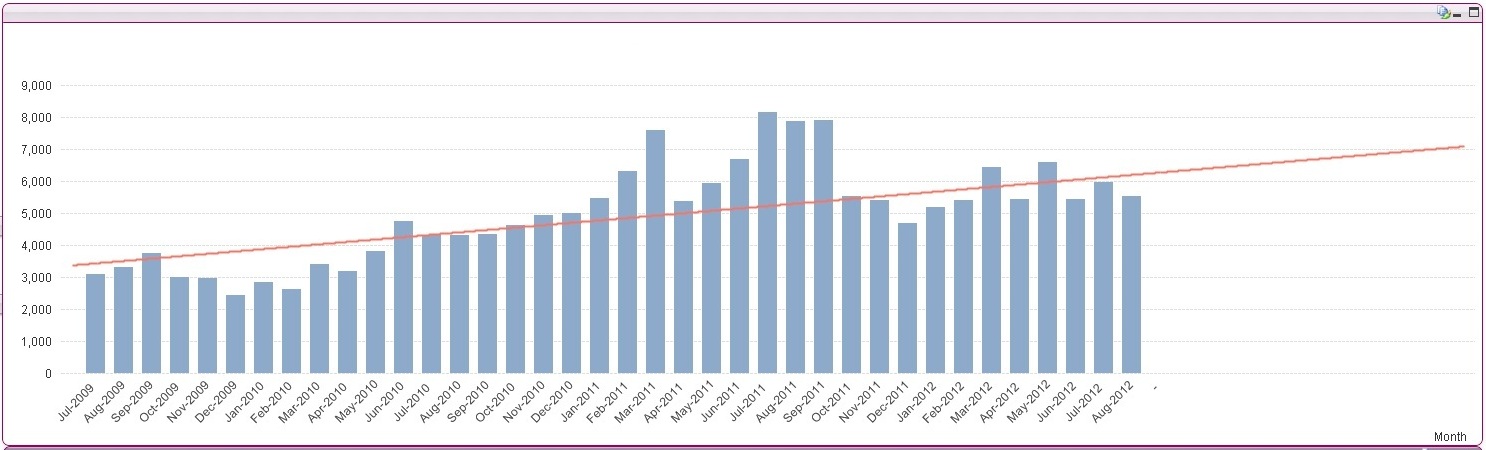
Any idea how I do this? I can't see how to reveal any numbers in the trend line (indeed my research tells me thats not possible) and I can't see a way to show the equation for the trend line.
Any ideas?
Thanks for looking
Rob
- Mark as New
- Bookmark
- Subscribe
- Mute
- Subscribe to RSS Feed
- Permalink
- Report Inappropriate Content
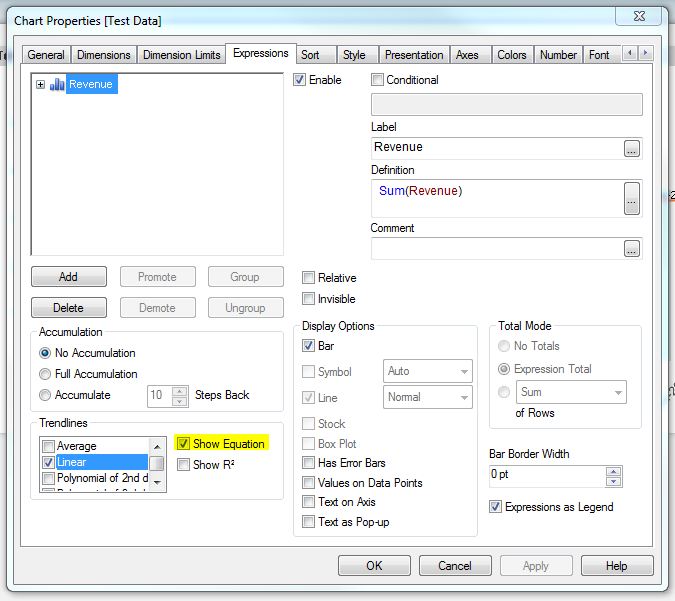
On Chart Properties > Expressions > Select 'Show Equation' under 'Trendlines':
- Mark as New
- Bookmark
- Subscribe
- Mute
- Subscribe to RSS Feed
- Permalink
- Report Inappropriate Content
Hi,
Thanks for the response.
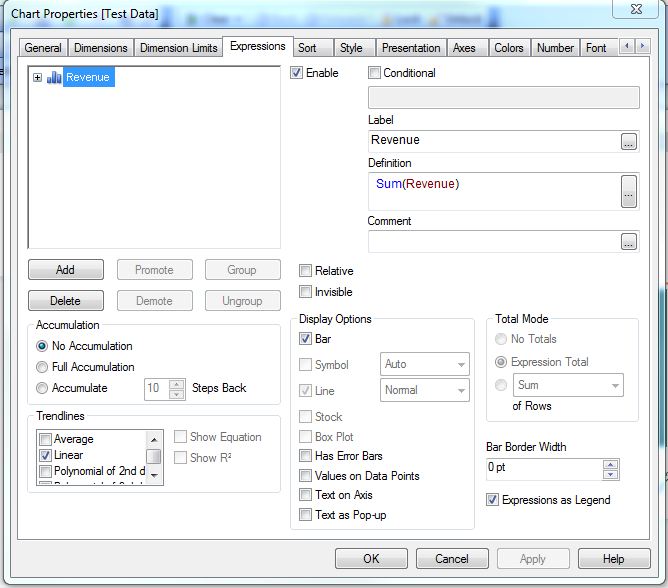
On my Qlikview (V11.00.11282.0 SR1 64-bit Edition (x64) ) that option is greyed out. I can't click it.
Is this a limitation of the personal edition? If so is there another way to to do this? (If not, how do I fix it?)
- Mark as New
- Bookmark
- Subscribe
- Mute
- Subscribe to RSS Feed
- Permalink
- Report Inappropriate Content
Mine does that too. It's weird, you have to select inside the line to make it not greyed out.
What it looks like at first:
When you click on the line 'Linear':

- Mark as New
- Bookmark
- Subscribe
- Mute
- Subscribe to RSS Feed
- Permalink
- Report Inappropriate Content
It's easiest if you de-select it and re-select it by the way.
- Mark as New
- Bookmark
- Subscribe
- Mute
- Subscribe to RSS Feed
- Permalink
- Report Inappropriate Content
If you want to actually use the value of the slope of your trend line in another calculation, look into the linest_m (resp. linest_b) functions.
{in the Help, chapter "Statistical Aggregation Functions in Charts")
Hope this helps,
Stefan
- Mark as New
- Bookmark
- Subscribe
- Mute
- Subscribe to RSS Feed
- Permalink
- Report Inappropriate Content
Hi guys,
Thanks for that.
Stefan, what I ultimately need is effectively the area underneath it, so that will help greatly. Thanks.